Consumer Equilibrium 25h67
This document was ed by and they confirmed that they have the permission to share it. If you are author or own the copyright of this book, please report to us by using this report form. Report 3i3n4
Overview 26281t
& View Consumer Equilibrium as PDF for free.
More details 6y5l6z
- Words: 738
- Pages: 2
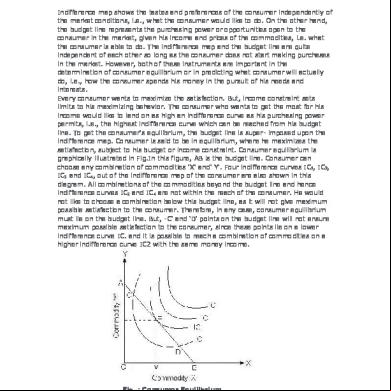
Consumer Equilibrium Indifference map shows the tastes and preferences of the consumer independently of the market conditions, i.e., what the consumer would like to do. On the other hand, the budget line represents the purchasing power or opportunities open to the consumer in the market, given his income and prices of the commodities, i.e. what the consumer is able to do. The indifference map and the budget line are quite independent of each other so long as the consumer does not start making purchases in the market. However, both of these instruments are important in the determination of consumer equilibrium or in predicting what consumer will actually do, i.e., how the consumer spends his money in the pursuit of his needs and interests. Every consumer wants to maximize the satisfaction. But, income constraint sets limits to his maximizing behavior. The consumer who wants to get the most for his income would like to land on as high an indifference curve as his purchasing power permits, i.e., the highest indifference curve which can be reached from his budget line. To get the consumer's equilibrium, the budget line is super- imposed upon the indifference map. Consumer is said to be in equilibrium, where he maximizes the satisfaction, subject to his budget or income constraint. Consumer equilibrium is graphically illustrated in Fig.In this figure, AB is the budget line. Consumer can choose any combination of commodities 'X' and' Y'. Four indifference curves IC1, IC2, IC3 and IC4, out of the indifference map of the consumer are also shown in this diagram. All combinations of the commodities beyond the budget line and hence indifference curves IC3 and IC4 are not within the reach of the consumer. He would not like to choose a combination below this budget line, as it will not give maximum possible satisfaction to the consumer. Therefore, in any case, consumer equilibrium must lie on the budget line. But, -C' and 'D' points on the budget line will not ensure maximum possible satisfaction to the consumer, since these points lie on a lower indifference curve IC. and it is possible to reach a combination of commodities on a higher indifference curve IC2 with the same money income.
Fig. : Consumer Equilibrium
Indifference curve IC2 is the highest indifference curve that the consumer can reach, given his budget constraint. The budget line touches this indifference curve at point 'E'. This is the point of consumer equilibrium, where the consumer purchases OM quantity of commodity 'X' and ON quantity of commodity 'Y’ All other points on the budget line to the left or right of point 'E' lie on lower indifference curves and thus indicate a lower level of satisfaction .Thus, given the budget constraint, the consumer maximizes his satisfaction at the point, where his budget line is tangential to an indifference curve. The budget line can be tangent to one and only one indifference curve. It we draw a budget line, which is tangent to two or more indifference curves, it would necessitate intersection of the curve, which is against the properties of indifference curves.
CHANGES: Consumer Equilibrium, Changes in Prices The consumer's choice of how much to consume of various goods depends on the prices of those goods. If prices change, the consumer's equilibrium choice will also change. To see how, consider again the example considered above where the consumer must decide how much to consume of goods 1 and 2. Suppose that the price of good 1 increases from $2 per unit to $3 per unit, while the price of good 2 remains unchanged at $1 per unit. Everything else remains the same; the consumer's budget is still $5, and the marginal utility that the consumer receives from each additional unit of goods 1 and 2 is unchanged. However, the ratio of the marginal utility of good 1 to the price of good 1 is now changed, due to the increase in the price of good 1. The new situation is reported in Table 1 . TABLE 1 Illustration of Consumer Equilibrium. Price of good 1 = $3, Price of good 2 = $1, Budget = $5 Units of good 1 MU of good 1 MU/price of good 1 Units of good 2 MU of good 2 MU/price of good 2 1
24
8
1
9
9
2
18
6
2
8
8
3
12
4
3
5
5
4
6
2
4
1
1
Read more: http://www.cliffsnotes.com/study_guide/Consumer-Equilibrium-Changes-in-Prices.topicArticleId9789,articleId-9754.html#ixzz12IP8MreM
Related Documents 3h463d
Consumer Equilibrium 25h67
December 2021 0
Consumer Equilibrium 25h67
December 2019 38
Equilibrium 1x4h6b
April 2022 0
Producer Equilibrium 5z6652
April 2021 0
Unit 2 Economics Notes Micro Ch02 Consumer Equilibrium And Demand 4z1t3q
November 2019 47
Ionic Equilibrium 2e3i3a
December 2020 0More Documents from "Shaila Shammi Unjila" 4g2120
Consumer Equilibrium 25h67
December 2021 0
Lesson Plan On Postanatal Assessment 5a484d
October 2019 81
1450 03 Palans Pneumatiques Et Chariots Atlas Copco 1w265m
October 2022 0
C 4m1x3w
April 2021 0
1490 01 The Lsv39 Range Atlas Copco 1fk2
November 2022 0