Economic Implication On Break Even Point 245s6q
This document was ed by and they confirmed that they have the permission to share it. If you are author or own the copyright of this book, please report to us by using this report form. Report 3i3n4
Overview 26281t
& View Economic Implication On Break Even Point as PDF for free.
More details 6y5l6z
- Words: 1,093
- Pages: 24
Y Y
Y Y
m m Õ Origins in the economic concept of the " ´ Õ `reak even can be expressed in of: -Value -Time -Quantity
m m The point where sales or revenue will equal expenses and there is no profit made or loss incurred at that point
Õ §t which sales will equal costs Õ §t which income matches expenditure.
] m Õ mmportant who manages a business Õ Powerful quantitative tool for managers Õ Starting of `usiness ÕManagers can use this information
m M Õ mt is a point where sales revenue equals the costs to make and sell the product and no profit or loss is reported. Õ The `reak Even Point of a company or a unit of a company is the level of sales income which will equal to the sum of its fixed cost and variable costs. Õ The `reak Even Point is that point of activity (sales volume) where total revenues and total expenses are equal, it is the point of zero profit and zero loss.
w Õ mn the linear Cost-Volume-Profit §nalysis model, the ë (in of Unit Sales (X)) can be directly computed in of Total Revenue (TR) and Total Costs (TC) as: TR=TC P X = TFC + V X P X ± V X = TFC ( P ± V ) X = TFC X = TFC P-V where: Õ is , Õ Y is ë Y , and Õ 0 is ë0 ë .
w Õ The break-even point can be more simply computed as the
point where Total Contribution = Total Fixed Cost:
ë ëëë ë ë ë ëë
Õmn currency units (sales proceeds) to reach break-even, one can use the above calculation and multiply by Price, or equivalently use the Contribution Margin Ratio (Unit Contribution Margin over Price) to compute it as 0 Y
[ Õ `reak-even analysis is only a supply side (ë costs only) analysis. Õ mt assumes that fixed costs (FC) are constant. §lthough, this is true in the short run, an increase in the scale of production is likely to cause fixed costs to rise. Õ mt assumes average variable costs are constant per unit of output, at least in the range of likely quantities of sales. (ë linearity) Õ mt assumes that the quantity of goods produced is equal to the quantity of goods sold . Õ mn multi-product companies, it assumes that the relative proportions of each product sold and produced are constant
m m m Õ Expenses can be classified as either variable or fixed Õ CVP relationships are linear over a wide range of production and sales Õ Sales prices, unit variable cost, and total fixed expenses will not vary within the relevant range
w Õ Volume is the only cost driver Õ The relevant range of volume is specified Õ mnventory levels will be unchanged Õ The sales mix remains unchanged during the period
m Õ : Õ § higher price or lower price does not mean that break even will be reached! ÕThe break even point depends on the number of sales needed to generate revenue to cover costs ± the break even chart is NOT time related!
Õ mmportance of Price Elasticity of Demand: Õ Higher prices might mean fewer sales to break even but those sales may take a longer time to achieve Õ Lower prices might encourage more customers but higher volume needed before sufficient revenue generated to break even
ë Õ Penetration pricing ± µhigh¶ volume, µlow¶ price ± more sales to break even Õ Market Skimming ± µhigh¶ price µlow¶ volumes ± fewer sales to break even Õ Elasticity ± what is likely to happen to sales when prices are increased or decreased?
"$
`
m ! "#
M
j
M
"% m ! "#
& '(( )*+,-,,,-) . ( )/-,,, !*+,,-,,,#
MARGIN OF SAFETY â
M The quantity of units produced (or sales of these units) which are above the breakeven point is known as MOS
§(( 0 Excess of actual sales revenue over the breakeven sales revenue, expressed usually as a percentage. The greater this margin, the less sensitive the firm to any abrupt fall in revenue. Formula: (§ctual sales revenue - `reakeven sales revenue) x 100 ÷ §ctual sales revenue.
w 0 The Margin of Safety is the difference between actual sales and sales at break even point 0 V Margin of safety = §ctual Sales ± Sales at `ep
V Ë Suppose the Sales of XYZ ltd,is 1,20,000 units and the sales at `ep is 90,000 units, then M/S=1,20,000units-90,000units = 30,000units Ë ()( 1 1 Y23 -( Ë 24Y Y23
V WXY $" w
D
w w
!" # #$
YZ [ \
D
] ^] ^ # [ #
_#
Z `\a# bbb ` cbbd [ ` #
_$cbb "_# ^ ` _Z `\
Y]"!]
"[^ `
^ ] _ W
" ` w ]Z !" # #$ ^ ` ^"`\
V 0 Higher Margin of Safety Provides greater protection to the company. The size of Margin of safety is an indicator of soundness of business 0 mt shows how much sales will decrease before the firm will suffer the loss 0 Sales beyond the `reak Even Point represent margin of Safety 0 Larger the Margin of Safety, Greater the soundness of business and Vice-Versa«
1. 2. 3. 4.
mncrease the level of production Reduce the Fixed and/ or Variable cost mncrease the Selling Price Substitute the existing product with more profitable products 5. From the product mix, remove the product whose contribution ratio is very low
Related Documents 3h463d

Economic Implication On Break Even Point 245s6q
August 2021 0
Break-even Point Notes 5b2j3b
December 2019 34
8-break Even Point 26i72
November 2019 60
Break Even Point For Hotels 226u2s
November 2019 54
Contoh Analisa Bep (break Even Point) 545b5c
November 2019 24
Break Even Point Computation For Hotel 6jr1v
April 2020 23More Documents from "Parvaz Shaikh" 372z3m
Economic Implication On Break Even Point 245s6q
August 2021 0
Pec Questionnaire And Score Sheet (1) 62931
November 2021 0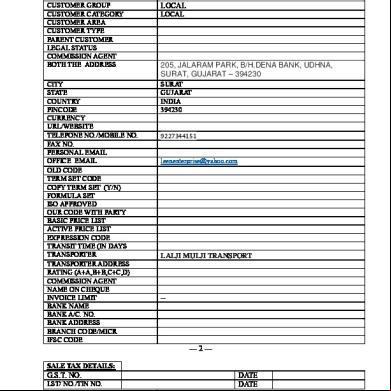
Customer Master Entry Form - Leen Enterprise 1b6o3j
October 2019 69
Supervisory Skills Assessment f1a35
October 2019 81
Bicmos Technology.pdf 566j1k
December 2019 56