Historical Demand And Supply 1 5u3o4d
This document was ed by and they confirmed that they have the permission to share it. If you are author or own the copyright of this book, please report to us by using this report form. Report 3i3n4
Overview 26281t
& View Historical Demand And Supply 1 as PDF for free.
More details 6y5l6z
- Words: 362
- Pages: 7
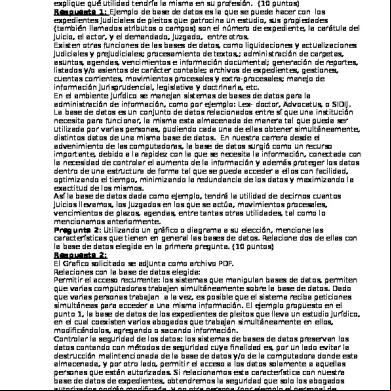
Historical Demand and Supply of Hydrochloric Acid 2005 2006 2007 2008 2009 2010 2011 2012 2013 2014
Demand 1,813,492 1,565,515 3,172,319 3,378,624 6,655,161 9,615,561 3,616,624 4,521,080 6,148,120 1,698,033
Supply
113 163,209 38,978 1868 493,600 440,000
12,000,000 10,000,000 8,000,000 6,000,000
Demand Supply
4,000,000 2,000,000 0 2004 2006 2008 2010 2012 2014 2016
Historical Demand and Supply of Raw Materials
Process 1:
Production of Hydrochloric Acid Using Salt Sulfuric Acid
1. Historical Demand and Supply of Sulfuric Acid Year 2005 2006 2007 2008 2009 2010 2011 2012 2013 2014
Demand 81,519,601 259,030,908 266,775,008 339,458,428 584,607,442 504,684,256 665,212,039 715,031,582 687,767,630 521,289,061
Supply 130,639,731 267,466,746 294,406,917 506,504,645 301,409,332 428,932,669 301,784,493 46,673,737 98,388,851 321,152,159
800,000,000 700,000,000 600,000,000 500,000,000 Demand
400,000,000
Supply
300,000,000 200,000,000 100,000,000 0 2004
2006
2008
2010
2012
2014
2. Sodium Chloride Year 2005 2006 2007 2008 2009 2010 2011 2012 2013 2014
Demand 22,636,288 31,674,182 41,257,674 51,965,428 79,006,140 81,281,670 102,221,336 102,221,336 136,830,344 176,843,660
Supply 342,957,043 382,668,437 347,638,746 404,040,809 436,573,136 460,670,419 365,330,949 427,720,981 349,754,223 453,275,380
500,000,000 450,000,000 400,000,000 350,000,000 300,000,000 250,000,000
Demand
200,000,000
Supply
150,000,000 100,000,000 50,000,000 0 2004 2006 2008 2010 2012 2014 2016
Process 3: 1. Historical Demand and Supply of Chlorine Year 2005 2006 2007 2008 2009 2010 2011 2012 2013 2014
Demand 3,622,385 9,289,385 16,616,841 20,981,505 5,547,974 18,663,812 20,808,872 25,722,747 7,804,867 22,670,938
Supply 4,949,274 4,664,027 5,531,517 9,205,173 6,982,921 9,949,597 12,315,697 14,109,430 13,754,585 9,380,321
30,000,000 25,000,000 20,000,000 15,000,000
Demand Supply
10,000,000 5,000,000 0 2004 2006 2008 2010 2012 2014 2016
Process 2:
Production of Hydrochloric Acid from the Combination of Hydrogen and Chlorine
1. Sodium Chloride Year 2005 2006 2007 2008 2009 2010 2011 2012 2013 2014
Demand 22,636,288 31,674,182 41,257,674 51,965,428 79,006,140 81,281,670 91,312,974 102,221,336 136,830,344 176,843,660
Supply 342,957,043 382,668,437 347,638,746 404,040,809 436,573,136 460,670,419 365,330,949 427,720,981 349,754,223 453,275,380
500,000,000 450,000,000 400,000,000 350,000,000 300,000,000 250,000,000
Demand
200,000,000
Supply
150,000,000 100,000,000 50,000,000 0 2004 2006 2008 2010 2012 2014 2016
2. Sodium Hydroxide Year 2005 2006 2007 2008 2009 2010 2011 2012 2013 2014
Demand 50,752,188 88,963,002 89,047,572 75,791,648 91,445,250 77,476,184 85,550,802 87,637,927 94,645,484 124,887,257
Supply 17,890,021 19,343,446 20,282,888 23,838,339 25,558,587 25,751,551 26,606,089 28,848,288 35,313,080 57,551,935
140,000,000 120,000,000 100,000,000 80,000,000 Demand 60,000,000 40,000,000 20,000,000 0 2004 2006 2008 2010 2012 2014 2016
Supply
Related Documents 3h463d

Historical Demand And Supply 1 5u3o4d
December 2019 23
Demand And Supply Analysis 3v513l
December 2019 56
Demand And Supply Forecasting 6h1cd
October 2019 67
Supply And Demand Simulation 452v4u
December 2019 38
Supply And Demand s43s
February 2021 0
Demand And Supply Analysis.pdf 686r6j
November 2019 61More Documents from "John Dolph Facundo" 3ru6h
Historical Demand And Supply 1 5u3o4d
December 2019 23
05 Selva Tucumano Boliviana 312k2n
December 2019 80
Requisitos Ciudadania Italiana 4v393
May 2022 0
Queens Of The Stone Age - No One Knows b2c3v
June 2022 0
Las 4 Regiones Del Peru 5l515m
May 2021 0