Jd Edwards Financial Best Practice Series – Creating A Chart Of s - Smartbridge d3x1p
This document was ed by and they confirmed that they have the permission to share it. If you are author or own the copyright of this book, please report to us by using this report form. Report 3i3n4
Overview 26281t
& View Jd Edwards Financial Best Practice Series – Creating A Chart Of s - Smartbridge as PDF for free.
More details 6y5l6z
- Words: 2,186
- Pages: 11
2/4/2016
JD Edwards Financial Best Practice Series – Creating a Chart of s Smartbridge
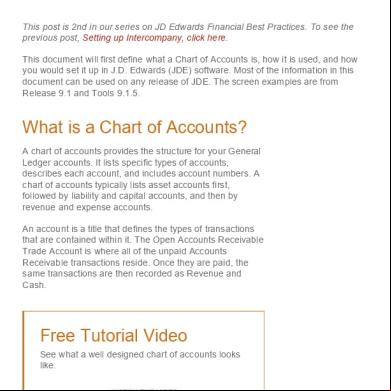
JD Edwards Financial Best Practice Series – Creating a Chart of s This post is 2nd in our series on JD Edwards Financial Best Practices. To see the previous post, Setting up Intercompany, click here. This document will first define what a Chart of s is, how it is used, and how you would set it up in J.D. Edwards (JDE) software. Most of the information in this document can be used on any release of JDE. The screen examples are from Release 9.1 and Tools 9.1.5.
What is a Chart of s? A chart of s provides the structure for your General Ledger s. It lists specific types of s, describes each , and includes numbers. A chart of s typically lists asset s first, followed by liability and capital s, and then by revenue and expense s. An is a title that defines the types of transactions that are contained within it. The Open s Receivable Trade is where all of the unpaid s Receivable transactions reside. Once they are paid, the same transactions are then recorded as Revenue and Cash.
Free Tutorial Video See what a well designed chart of s looks like. WATCH THE VIDEO
http://smartbridge.com/jdefinancecreatingcharts/
1/11
2/4/2016
JD Edwards Financial Best Practice Series – Creating a Chart of s Smartbridge
Deg the Chart of s To design your chart of s: 1. Begin your initial design with the major headings of your transactions. 2. Then add your detailed transaction descriptions. A Chart of s is generally divided into major groups of s. The grossest grouping are the Balance Sheet and the Income Statement or Profit and Loss Statement. The Balance Sheet always precedes the Income Statement especially in JDE. Within those major groupings there are more groups, each defining the amounts into more detailed groups. The most common structure of a Chart of s follows these major groups: The Balance Sheet contains the information that is both of a more longterm nature and presents a picture of the Company’s worth. Groups or sections of the Balance Sheet: Assets Liabilities Owner’s Equity of Capital These are often broken down further into smaller sections such as: Assets Current Assets – the most liquid of the Company’s Assets; Cash, for example Capital Assets – not as liquid as cash but one could exchange for cash if the need arose; Vehicles, Buildings, Equipment, etc. Inventory – goods held to be sold Liabilities Long Term Liabilities – loans taken out to finance a building, for example Short Term Liabilities – reflects potential drains on the Company’s resources; s Payable Owner’s Equity of Capital The amount that was pooled to start the Company, perhaps from the sale of
http://smartbridge.com/jdefinancecreatingcharts/
2/11
2/4/2016
JD Edwards Financial Best Practice Series – Creating a Chart of s Smartbridge
The amount that was pooled to start the Company, perhaps from the sale of Stock Retained Earnings – monies that the Company has made in prior years The Income Statement contains the more detailed information to the breakdown of the Balance Sheet. This has only two major groups: Revenue (Income) Expenses This is where the daily transactions of running the Company are recorded; Sales of goods or services and the cost, Expenses, incurred to make those goods or provide the services. These are broken down even more to be able to track the income and/or expenses for a particular product or service. Usually also related to a specific Department or Warehouse or Job. Obviously, the difference between Revenue and Expenses equals Profit.
Setting the Chart of s up in JDE The Structure in JDE is Business Unit, period, Object , period, Subsidiary . Business Units describe where in your organization the transaction will have an impact. It represents the lowest organizational level within your business where you record all revenues, expenses, assets, liabilities, and equities. Business units typically represent a location, department, work center, or job, etc. The Object is the type of monies. It could be Cash or Open s Receivable or Transistor Sales. It will be used as the description of the transaction. It is strongly recommended that the same numbering and description be consistent for all companies and business units for consolidation roll ups. More on that later… The Subsidiary is the optional part of the Number. It is used in the General Ledger as a further breakdown of the Object ; Cash as the Object with a subsidiary dividing up the different bank s, for example, Cash in Bank of America. In Job Costing, the Subsidiary is used to http://smartbridge.com/jdefinancecreatingcharts/
3/11
2/4/2016
JD Edwards Financial Best Practice Series – Creating a Chart of s Smartbridge
define the Phase of a Job and that discussion is out of the scope of this document. Here is a portion of a welldefined Balance Sheet.
In JDE there are two other fields that can be used to further define the : Alternate and Subledger. Alternate Object.Subsidiary (obj.sub) can be used to comply with a regulatory chart of s, parent company requirements, a thirdparty coding scheme, or as the number from a prior system used as a cross reference. Subledgers – Another further division of data. Subledger values must be defined to the system as the values used in the subledger are validated by type. If the subledger is an Address Book Number, that Address Book Number must exist in the Address Book Master before it can be used. There is a unique systemassigned Short ID assigned to each unique combination of Business Unit, Object, and Subsidiary. Balances are stored by this unique key. However, subledgers are an additional field which equates to an additional balance. In other words, the unique combination in the table above, 1.3005.004, would have a Short ID of, for example, 00801045 (this is an alphanumeric value so leading zeros are significant). That has a single balance record per Fiscal Year per Ledger Type. However, if I were to decide to use a subledger with that , the Short ID would still be 00801045 and there would be an additional balance per Fiscal Year per Ledger Type for 1.3005.004 subledger xxxxxxxx. There are two more very important fields in the JDE Chart of s: Posting Edit Codes and Levels of Detail.
http://smartbridge.com/jdefinancecreatingcharts/
4/11
2/4/2016
JD Edwards Financial Best Practice Series – Creating a Chart of s Smartbridge
POSTING EDIT CODES (PEC) Posting Edit Codes are used to indicate the different usages of the s for functions such as headings, s reserved for budgeting only or system generated amounts only. Assign a posting edit code to every object or object.subsidiary in the chart of s. This code determines whether the posts to the General Ledger and whether it updates the Balances table (F0902). Valid Posting Edit Codes and their purpose are defined in this table:
JDE Help Text explaining the Codes listed above:
http://smartbridge.com/jdefinancecreatingcharts/
5/11
2/4/2016
JD Edwards Financial Best Practice Series – Creating a Chart of s Smartbridge
LEVELS OF DETAIL Levels of Detail are JDE’s way of allowing great flexibility across any different types of corporations all over the world without requiring to have the same COA. That way your COA matches the needs of your company rather than the COA that JDE dictates you use. Level of Detail is used to summarize and classify s in the General Ledger. The chart below illustrates how the Levels of Detail work:
http://smartbridge.com/jdefinancecreatingcharts/
6/11
2/4/2016
JD Edwards Financial Best Practice Series – Creating a Chart of s Smartbridge
Level 9 is the most detailed and Level 1 is the least detailed. Levels 1 and 2 are reserved for company and business unit totals. Levels 8 and 9 are reserved for posting s in the Job Cost system. Level 3 is assigned to title s for the balance sheet Assets Liabilities and Equity Levels 3 or 4 are assigned to title s for the income statement. Title s include: Revenues Direct costs General and istrative expenses Other income and expenses EXAMPLES OF LOD 3: Assets, Liabilities, Revenues, Expenses. 4: Current Assets, Fixed Assets, Current Liabilities, and so on. 5: Cash, s Receivable, Inventories, Salaries, and so on. http://smartbridge.com/jdefinancecreatingcharts/
7/11
2/4/2016
JD Edwards Financial Best Practice Series – Creating a Chart of s Smartbridge
6: Petty Cash, Cash in Banks, Trade s Receivable, and so on. 7: Petty Cash – Corporate, Petty Cash – Branch, and so on.
REQUIREMENTS Balance Sheet must be first Last Balance Sheet must be Net Income with a Posting Edit Code of ‘N’, Nonposting. The system calculates Net Income on the Balance Sheet. Next to last Balance Sheet needs to be Retained Earnings. This must have a Posting Edit Code of ‘M’, Machine Generated. Numbers are sequential – Balance Sheet from 1000 – 4999, Income Statement from 5000 on up, for example
RECOMMENDATIONS Take advantage of JDE’s standard functionality and create a Model Chart of s first Set up both a Model Company and a Model Business Unit Set up the Model Chart of s within that Model Company and Business Unit Models can be specific to a particular type of business (Water, Energy, Construction) Use the Models to set up the Chart of s for all other Business Units needed This will insure consistency across all Business Units of the same type Keep the Model current to business needs Set up PEC’s to be consistent across all companies Use Category codes (Segments of the business: Geo, Water resources, Mineral services, Energy services, Heavy Civil, etc.) for different reporting needs Provides reporting flexibility without changing the Chart of s Record Category Code usage in the Model and in documentation available to personnel that will be responsible for maintenance of the COA http://smartbridge.com/jdefinancecreatingcharts/
8/11
2/4/2016
JD Edwards Financial Best Practice Series – Creating a Chart of s Smartbridge
UNDERSTANDING A MODEL CHART OF S Create one master model business unit that includes the complete chart of s or create a model business unit for every business unit type and assign object s to it. You can then use these models as a basis for your actual chart of s. By creating a model chart of s, you ensure that when you copy the s from the model business units into your actual (or production) business units, the s are standardized across business units and companies. You should create your model chart of s using a consistent numbering scheme for your object s so that they can be copied across all business units. After you enter the business unit, object , and subsidiary information for a new , you can add a comment, memo, or other text. Carefully proofread your model chart of s to ensure that the descriptions, spelling, level of detail assignments, and posting edit codes are accurate. The model chart of s provides the basis for your entire chart of s. Revise s as needed to correct errors before you copy the model s to business units. Copying the model reproduces any errors in multiple business units. Some businesses need an alternate way to set up a chart of s. For example, some countries require businesses to submit reports using a governmentdefined (statutory) chart of s. You can use category codes to set up an alternate chart of s that accommodates government requirements.
UNDERSTANDING ALTERNATE CHART OF S Using an alternate chart of s, you can: Roll up (summarize) s. Display subtotals. View several companies at one time. http://smartbridge.com/jdefinancecreatingcharts/
9/11
2/4/2016
JD Edwards Financial Best Practice Series – Creating a Chart of s Smartbridge
View s that make up an alternate . View different levels of detail in other JD Edwards EnterpriseOne inquiry programs. You can display balances by alternate or statutory s from the General Ledger Balance table. To do this, use one of the category codes that are set up for a statutory chart of s. An category code indicates your statutory number and the category code description indicates the description. You can assign one or more alternate numbers to category codes 21, 22, and 23 ( Defined Code table (UDC) 09/21–09/23). These category codes allow up to ten characters. The system rolls up s that are based on the digit that you specify. All s in which the digit matches are rolled together. For example, if you specify the third digit, then s from 1040000 through 1049999 are rolled together. You can review alternate s and ledgers for one category code at a time. You specify the category code in the processing options. You can also review alternate s by company or organization structure, and you can review their balances online by company or organization structure. By doing this review, you can see several companies that comprise one legal entity.
Watch the Video Tutorial!
http://smartbridge.com/jdefinancecreatingcharts/
10/11
2/4/2016
JD Edwards Financial Best Practice Series – Creating a Chart of s Smartbridge
http://smartbridge.com/jdefinancecreatingcharts/
11/11
JD Edwards Financial Best Practice Series – Creating a Chart of s Smartbridge
JD Edwards Financial Best Practice Series – Creating a Chart of s This post is 2nd in our series on JD Edwards Financial Best Practices. To see the previous post, Setting up Intercompany, click here. This document will first define what a Chart of s is, how it is used, and how you would set it up in J.D. Edwards (JDE) software. Most of the information in this document can be used on any release of JDE. The screen examples are from Release 9.1 and Tools 9.1.5.
What is a Chart of s? A chart of s provides the structure for your General Ledger s. It lists specific types of s, describes each , and includes numbers. A chart of s typically lists asset s first, followed by liability and capital s, and then by revenue and expense s. An is a title that defines the types of transactions that are contained within it. The Open s Receivable Trade is where all of the unpaid s Receivable transactions reside. Once they are paid, the same transactions are then recorded as Revenue and Cash.
Free Tutorial Video See what a well designed chart of s looks like. WATCH THE VIDEO
http://smartbridge.com/jdefinancecreatingcharts/
1/11
2/4/2016
JD Edwards Financial Best Practice Series – Creating a Chart of s Smartbridge
Deg the Chart of s To design your chart of s: 1. Begin your initial design with the major headings of your transactions. 2. Then add your detailed transaction descriptions. A Chart of s is generally divided into major groups of s. The grossest grouping are the Balance Sheet and the Income Statement or Profit and Loss Statement. The Balance Sheet always precedes the Income Statement especially in JDE. Within those major groupings there are more groups, each defining the amounts into more detailed groups. The most common structure of a Chart of s follows these major groups: The Balance Sheet contains the information that is both of a more longterm nature and presents a picture of the Company’s worth. Groups or sections of the Balance Sheet: Assets Liabilities Owner’s Equity of Capital These are often broken down further into smaller sections such as: Assets Current Assets – the most liquid of the Company’s Assets; Cash, for example Capital Assets – not as liquid as cash but one could exchange for cash if the need arose; Vehicles, Buildings, Equipment, etc. Inventory – goods held to be sold Liabilities Long Term Liabilities – loans taken out to finance a building, for example Short Term Liabilities – reflects potential drains on the Company’s resources; s Payable Owner’s Equity of Capital The amount that was pooled to start the Company, perhaps from the sale of
http://smartbridge.com/jdefinancecreatingcharts/
2/11
2/4/2016
JD Edwards Financial Best Practice Series – Creating a Chart of s Smartbridge
The amount that was pooled to start the Company, perhaps from the sale of Stock Retained Earnings – monies that the Company has made in prior years The Income Statement contains the more detailed information to the breakdown of the Balance Sheet. This has only two major groups: Revenue (Income) Expenses This is where the daily transactions of running the Company are recorded; Sales of goods or services and the cost, Expenses, incurred to make those goods or provide the services. These are broken down even more to be able to track the income and/or expenses for a particular product or service. Usually also related to a specific Department or Warehouse or Job. Obviously, the difference between Revenue and Expenses equals Profit.
Setting the Chart of s up in JDE The Structure in JDE is Business Unit, period, Object , period, Subsidiary . Business Units describe where in your organization the transaction will have an impact. It represents the lowest organizational level within your business where you record all revenues, expenses, assets, liabilities, and equities. Business units typically represent a location, department, work center, or job, etc. The Object is the type of monies. It could be Cash or Open s Receivable or Transistor Sales. It will be used as the description of the transaction. It is strongly recommended that the same numbering and description be consistent for all companies and business units for consolidation roll ups. More on that later… The Subsidiary is the optional part of the Number. It is used in the General Ledger as a further breakdown of the Object ; Cash as the Object with a subsidiary dividing up the different bank s, for example, Cash in Bank of America. In Job Costing, the Subsidiary is used to http://smartbridge.com/jdefinancecreatingcharts/
3/11
2/4/2016
JD Edwards Financial Best Practice Series – Creating a Chart of s Smartbridge
define the Phase of a Job and that discussion is out of the scope of this document. Here is a portion of a welldefined Balance Sheet.
In JDE there are two other fields that can be used to further define the : Alternate and Subledger. Alternate Object.Subsidiary (obj.sub) can be used to comply with a regulatory chart of s, parent company requirements, a thirdparty coding scheme, or as the number from a prior system used as a cross reference. Subledgers – Another further division of data. Subledger values must be defined to the system as the values used in the subledger are validated by type. If the subledger is an Address Book Number, that Address Book Number must exist in the Address Book Master before it can be used. There is a unique systemassigned Short ID assigned to each unique combination of Business Unit, Object, and Subsidiary. Balances are stored by this unique key. However, subledgers are an additional field which equates to an additional balance. In other words, the unique combination in the table above, 1.3005.004, would have a Short ID of, for example, 00801045 (this is an alphanumeric value so leading zeros are significant). That has a single balance record per Fiscal Year per Ledger Type. However, if I were to decide to use a subledger with that , the Short ID would still be 00801045 and there would be an additional balance per Fiscal Year per Ledger Type for 1.3005.004 subledger xxxxxxxx. There are two more very important fields in the JDE Chart of s: Posting Edit Codes and Levels of Detail.
http://smartbridge.com/jdefinancecreatingcharts/
4/11
2/4/2016
JD Edwards Financial Best Practice Series – Creating a Chart of s Smartbridge
POSTING EDIT CODES (PEC) Posting Edit Codes are used to indicate the different usages of the s for functions such as headings, s reserved for budgeting only or system generated amounts only. Assign a posting edit code to every object or object.subsidiary in the chart of s. This code determines whether the posts to the General Ledger and whether it updates the Balances table (F0902). Valid Posting Edit Codes and their purpose are defined in this table:
JDE Help Text explaining the Codes listed above:
http://smartbridge.com/jdefinancecreatingcharts/
5/11
2/4/2016
JD Edwards Financial Best Practice Series – Creating a Chart of s Smartbridge
LEVELS OF DETAIL Levels of Detail are JDE’s way of allowing great flexibility across any different types of corporations all over the world without requiring to have the same COA. That way your COA matches the needs of your company rather than the COA that JDE dictates you use. Level of Detail is used to summarize and classify s in the General Ledger. The chart below illustrates how the Levels of Detail work:
http://smartbridge.com/jdefinancecreatingcharts/
6/11
2/4/2016
JD Edwards Financial Best Practice Series – Creating a Chart of s Smartbridge
Level 9 is the most detailed and Level 1 is the least detailed. Levels 1 and 2 are reserved for company and business unit totals. Levels 8 and 9 are reserved for posting s in the Job Cost system. Level 3 is assigned to title s for the balance sheet Assets Liabilities and Equity Levels 3 or 4 are assigned to title s for the income statement. Title s include: Revenues Direct costs General and istrative expenses Other income and expenses EXAMPLES OF LOD 3: Assets, Liabilities, Revenues, Expenses. 4: Current Assets, Fixed Assets, Current Liabilities, and so on. 5: Cash, s Receivable, Inventories, Salaries, and so on. http://smartbridge.com/jdefinancecreatingcharts/
7/11
2/4/2016
JD Edwards Financial Best Practice Series – Creating a Chart of s Smartbridge
6: Petty Cash, Cash in Banks, Trade s Receivable, and so on. 7: Petty Cash – Corporate, Petty Cash – Branch, and so on.
REQUIREMENTS Balance Sheet must be first Last Balance Sheet must be Net Income with a Posting Edit Code of ‘N’, Nonposting. The system calculates Net Income on the Balance Sheet. Next to last Balance Sheet needs to be Retained Earnings. This must have a Posting Edit Code of ‘M’, Machine Generated. Numbers are sequential – Balance Sheet from 1000 – 4999, Income Statement from 5000 on up, for example
RECOMMENDATIONS Take advantage of JDE’s standard functionality and create a Model Chart of s first Set up both a Model Company and a Model Business Unit Set up the Model Chart of s within that Model Company and Business Unit Models can be specific to a particular type of business (Water, Energy, Construction) Use the Models to set up the Chart of s for all other Business Units needed This will insure consistency across all Business Units of the same type Keep the Model current to business needs Set up PEC’s to be consistent across all companies Use Category codes (Segments of the business: Geo, Water resources, Mineral services, Energy services, Heavy Civil, etc.) for different reporting needs Provides reporting flexibility without changing the Chart of s Record Category Code usage in the Model and in documentation available to personnel that will be responsible for maintenance of the COA http://smartbridge.com/jdefinancecreatingcharts/
8/11
2/4/2016
JD Edwards Financial Best Practice Series – Creating a Chart of s Smartbridge
UNDERSTANDING A MODEL CHART OF S Create one master model business unit that includes the complete chart of s or create a model business unit for every business unit type and assign object s to it. You can then use these models as a basis for your actual chart of s. By creating a model chart of s, you ensure that when you copy the s from the model business units into your actual (or production) business units, the s are standardized across business units and companies. You should create your model chart of s using a consistent numbering scheme for your object s so that they can be copied across all business units. After you enter the business unit, object , and subsidiary information for a new , you can add a comment, memo, or other text. Carefully proofread your model chart of s to ensure that the descriptions, spelling, level of detail assignments, and posting edit codes are accurate. The model chart of s provides the basis for your entire chart of s. Revise s as needed to correct errors before you copy the model s to business units. Copying the model reproduces any errors in multiple business units. Some businesses need an alternate way to set up a chart of s. For example, some countries require businesses to submit reports using a governmentdefined (statutory) chart of s. You can use category codes to set up an alternate chart of s that accommodates government requirements.
UNDERSTANDING ALTERNATE CHART OF S Using an alternate chart of s, you can: Roll up (summarize) s. Display subtotals. View several companies at one time. http://smartbridge.com/jdefinancecreatingcharts/
9/11
2/4/2016
JD Edwards Financial Best Practice Series – Creating a Chart of s Smartbridge
View s that make up an alternate . View different levels of detail in other JD Edwards EnterpriseOne inquiry programs. You can display balances by alternate or statutory s from the General Ledger Balance table. To do this, use one of the category codes that are set up for a statutory chart of s. An category code indicates your statutory number and the category code description indicates the description. You can assign one or more alternate numbers to category codes 21, 22, and 23 ( Defined Code table (UDC) 09/21–09/23). These category codes allow up to ten characters. The system rolls up s that are based on the digit that you specify. All s in which the digit matches are rolled together. For example, if you specify the third digit, then s from 1040000 through 1049999 are rolled together. You can review alternate s and ledgers for one category code at a time. You specify the category code in the processing options. You can also review alternate s by company or organization structure, and you can review their balances online by company or organization structure. By doing this review, you can see several companies that comprise one legal entity.
Watch the Video Tutorial!
http://smartbridge.com/jdefinancecreatingcharts/
10/11
2/4/2016
JD Edwards Financial Best Practice Series – Creating a Chart of s Smartbridge
http://smartbridge.com/jdefinancecreatingcharts/
11/11
Related Documents 3h463d

Jd Edwards -- Advance Pricing 5m6233
December 2019 58
Chart Of s - Builder 562e68
October 2022 0
Chart Of s Format.ods m324e
May 2023 0
Nam Chart Of s 496e6
December 2019 50
Generic Chart Of s 4e3v4n
December 2019 43
Coop Chart Of s 4731
December 2019 50More Documents from "barber bob" 2d3d3a
4p345f
November 2019 49
111815100 Sap Authorization Su24 Su25 351mq
November 2019 26
501syllabus - Stat 501 Experimental Statistics I Purpose_ To Explain The 4ry21
January 2022 0
376_ 377 Bus Time Table 2o5o6x
November 2019 39
Ascii - Wikipedia 31te
August 2021 0