Psy Chart 5g17u
This document was ed by and they confirmed that they have the permission to share it. If you are author or own the copyright of this book, please report to us by using this report form. Report 3i3n4
Overview 26281t
& View Psy Chart as PDF for free.
More details 6y5l6z
- Words: 312
- Pages: 1
2.5 5
10
(h
10
15
t Sa
60
n
ur
io at
pe
m
te
p
tu
a er
re
0.8 4
% 6
6
0.8
%
50 %
40
Dry bulb temperature °C
20
0%
30%
8
30
y umidit lative h
0.8 10% re
C
re °
atu
per
em
lb t
t bu
we
20%
25
40
olu 2v
2
0.8
0
0.8
0.7
8
2
4
6
8
50
10
12
14
16
18
20
60
70
80
90
100
110
120
0.95 1.0
0.90
0.85
0.80
0.75
0.70
0.65
0.60
0.55
0.50
0.45
0.40
|
er p
0
0.9
Reprinted by permission of the American Society of Heating, Refrigerating and Air-Conditioning Engineers, Inc., Atlanta, GA; used with permission.
20
25
22
24
26
28
30
0.36
Appendix 1
FIGURE A–31 Psychrometric chart at 1 atm total pressure.
15
20
°C
80 0.9
Prepared by Center for Applied Thermodynamic Studies, University of Idaho.
10
2.0
5
30
50
En
py
al th
ilo )k
es ul jo
r ai
met md
40
Enthalpy Δh —————— = —— Humidity ratio Δ
am il 70 rk r og
y dr
30
gra
ilo er k
0
0
30 4
20
4.0
0.4
90
100 0.9
0
5.0
3
0.
10.0
– 0.2
–• 1.0 1.5 – 5.0 2.0 4.0 – 2.0 ΔHS – • Sensible heat —————– = —— – 4.0 0.0 Total heat ΔHT – 2.0 1.0 1.0
0.2
3.0
1.0 0.8 0.7 0.6 0.5
0.1
•
.5
%
–0
90
Sea Level
%
©1992 American Society of Heating, Refrigerating and Air-Conditioning Engineers, Inc.
bic
80
cu me
70
ASHRAE Psychrometric Chart No. 1 Normal Temperature Barometric Pressure: 101.325 kPa
cen84959_ap01.qxd 4/27/05 3:00 PM Page 929
929
ry a ir
ΔHS Sensible heat —————– = —— Total heat ΔHT Humidity ratio () grams moisture per kilogram dry air
10
(h
10
15
t Sa
60
n
ur
io at
pe
m
te
p
tu
a er
re
0.8 4
% 6
6
0.8
%
50 %
40
Dry bulb temperature °C
20
0%
30%
8
30
y umidit lative h
0.8 10% re
C
re °
atu
per
em
lb t
t bu
we
20%
25
40
olu 2v
2
0.8
0
0.8
0.7
8
2
4
6
8
50
10
12
14
16
18
20
60
70
80
90
100
110
120
0.95 1.0
0.90
0.85
0.80
0.75
0.70
0.65
0.60
0.55
0.50
0.45
0.40
|
er p
0
0.9
Reprinted by permission of the American Society of Heating, Refrigerating and Air-Conditioning Engineers, Inc., Atlanta, GA; used with permission.
20
25
22
24
26
28
30
0.36
Appendix 1
FIGURE A–31 Psychrometric chart at 1 atm total pressure.
15
20
°C
80 0.9
Prepared by Center for Applied Thermodynamic Studies, University of Idaho.
10
2.0
5
30
50
En
py
al th
ilo )k
es ul jo
r ai
met md
40
Enthalpy Δh —————— = —— Humidity ratio Δ
am il 70 rk r og
y dr
30
gra
ilo er k
0
0
30 4
20
4.0
0.4
90
100 0.9
0
5.0
3
0.
10.0
– 0.2
–• 1.0 1.5 – 5.0 2.0 4.0 – 2.0 ΔHS – • Sensible heat —————– = —— – 4.0 0.0 Total heat ΔHT – 2.0 1.0 1.0
0.2
3.0
1.0 0.8 0.7 0.6 0.5
0.1
•
.5
%
–0
90
Sea Level
%
©1992 American Society of Heating, Refrigerating and Air-Conditioning Engineers, Inc.
bic
80
cu me
70
ASHRAE Psychrometric Chart No. 1 Normal Temperature Barometric Pressure: 101.325 kPa
cen84959_ap01.qxd 4/27/05 3:00 PM Page 929
929
ry a ir
ΔHS Sensible heat —————– = —— Total heat ΔHT Humidity ratio () grams moisture per kilogram dry air
Related Documents 3h463d

Psy Chart 5g17u
August 2022 0
Psy 100_02 5s301k
November 2022 0
Psy Link 3545
August 2022 0
Psy - Daddy 44j2q
November 2019 80
Psy Ch 12 Quiz 6e6r4n
November 2019 45
Psy 200 Syllabus 5v6u47
December 2019 29More Documents from "Farzana Imroz" 265o1b
Psy Chart 5g17u
August 2022 0
Branches Of Zoogeography 386i1n
April 2022 0
November 2021 0

Internship Report On Transcom Digital 4r5x6
December 2019 45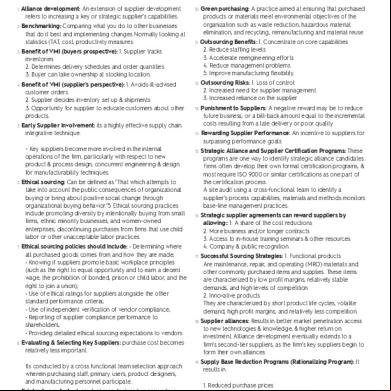
Quizlet Ch 4 316my
December 2019 62