Teson-benchmark-report-and-overview.pdf 2g6i6z
This document was ed by and they confirmed that they have the permission to share it. If you are author or own the copyright of this book, please report to us by using this report form. Report 3i3n4
Overview 26281t
& View Teson-benchmark-report-and-overview.pdf as PDF for free.
More details 6y5l6z
- Words: 5,040
- Pages: 32
TESON Benchmark test Bristol, May 2003
To prove the accuracy of the results of the on-line valve testing system TESON, test comparisons have been carried out to how close the TESON test results are to the set pressure of a valve, identified on a high volume development test bench. Result Worst divergence 5% Typical divergence < 3% Average divergence 2.4%
TESON Benchmark
1
Executive Summary The in situ set pressure verification, also known as on-line safety and relief valve testing has been recognised in industry since the early 80s. Different testing systems are to be found on the market since then. TESON did introduce a totally new approach on how to identify the set pressure within the result diagrams, created during the test procedure itself. Focusing on the fact, that a safety relief valve is primarily a preloaded spring, a spring performance diagram (force-lift-diagram) is generated from the recorded data. Within the spring performance diagram, the set pressure is easily and precisely found at the moment the valve disk starts to move. Considering the fact that the on-line test result is calculated, this leads to an uncertain theoretical result. Based on the calculus of error, the resulting uncertainty decreases the larger the valve is and the more line pressure (system pressure) there is when the valve is tested. To how close the TESON test results gets to the real set pressure, comparison tests have been carried out on a large volume test bench of a safety valve manufacturer in Bristol, U.K. A total of 32 tests have been carried out on 8 valves of different sizes at various line pressures. To most accurately find the set pressure point of the valves, the test bench was equipped with a digital lift and pressure recording system. Testing the new and overhauled valves, it became evident that initial lift and first audible leak appear together. Therefore, the set pressure identified on a test bench can be considered the real set pressure of a safety valve. Identifying the set pressure based on the initial lift as well, TESON reaches high result accuracy. Within the 32 tests carried out, the worst divergence between the test bench result and the TESON result was 5% where as 75% of the tests had a divergence of 3% or less. Most surprising, the divergence to be found is independent of valve size and line pressure. Based on those results, TESON has been proven to most accurately tell the real set pressure of the safety relief valve. Experiences show that on-line valve tests carried out in all different types of industrial plants lead to a significantly higher or lower set pressure of safety relief valves. As the TESON system has proven to tell the true set pressure, the explanation for the divergence is the valve in operational condition being different to the valve in workshop conditions when tested on the test bench. Whenever the safety relief valves set pressure is of a higher concern, it should be tested on-line in its operational conditions if possible.
2/14
TESON Benchmark
Content
1 Executive Summary _____________________________________________________ 2 2 Introduction ___________________________________________________________ 4 3 Test set up and facilities_________________________________________________ 4 3.1 Development test bench _____________________________________________ 5 3.1.1
Pressure system _____________________________________________ 5
3.1.2
Digital data recording system __________________________________ 6
3.2 TESON on-line valve testing system ____________________________________ 7 3.2.1
Sensor system _______________________________________________ 8
3.2.2
Software system and calculations_______________________________ 8
4 Test procedure _________________________________________________________ 9 4.1 Identifying the set pressure on the development test bench _______________ 9 4.2 Identifying the set pressure within the TESON test result_________________ 10 5 Test results ___________________________________________________________ 12 5.1 Result analysis ____________________________________________________ 13 5.2 Conclusions _______________________________________________________ 13 6 Appendix _____________________________________________________________ 14
3/14
TESON Benchmark
2
Introduction Identifying a safety valves set pressure in-situ while the connected pressure vessel remains in full operation is known as "on-line" testing or "in-situ set pressure verification" since the early 80's. This method utilises lifting equipment – so called test rigs – to open safety valves by pulling the valves spindle, recording the lifting force and the lift and pressure simultaneously. An expert is capable of identifying the set pressure point from the recorded diagram and to calculate the set pressure of the safety valve. TESON introduces a totally new and unique approach to on-line safety valve testing. The analysis and identification of the set pressure point based on a lift-force diagram and the spring performance of the safety valve that is created from the lift and force data, recorded during the test procedure itself. That approach leads to a clearly visible point in each diagram recorded, which is the very moment when the valve disk starts to lift from the nozzle. Within the TESON test, the "lifting point" is defined to be the set pressure point of the safety valve. The TESON approach does not require expertise and long time experience to find this lifting point, eliminating the option to technically "negotiate" a result towards a desired value there by. Neither does it require any observation of the valve during the test to find the set pressure point later. The only required source is the diagram itself, enabling a correct analysis even a long time after the test itself has been carried out. As TESON is recognised on the market to deliver most accurate results, a benchmark test should give a final overall accuracy where this is possible to be achieved. Due to the fact, that a standard workshop test bench can never offer enough pressure capacity to simulate an on-line valve test, it requires a huge volume test bench that can only be found in development laboratories of safety valve manufactures. Seetru Ltd, situated in Bristol, operates a development test bench, which is capable of identifying the real set pressure of a safety valve, as well as simulating the on-line test for the TESON system, which is utilised by their service department SES – Seetru Engineering Services. This document is the full report of the benchmark test performed at Seetru Ltd. in May 2003. It includes all details of the test set up, test procedures, as well as all test reports created during the two-day experiment in Bristol, U.K. All tests have been carried out under the supervision of Andrew Varga, MD Seetru Ltd., and Johannes Junior, MD METRUS GmbH, designer and producer of the TESON system.
3
Test set up and facilities The testing conditions to be found at the research and development laboratory at Seetru Ltd Albion Dockside Works, Bristol, U.K, as well as the available stock of various safety relief valves offers the required base to perform a convincing benchmark test.
4/14
TESON Benchmark
3.1
Development test bench The development test bench is designed to simulate real plant conditions up to approximately 40-bar system pressure.
3.1.1 Pressure system The pressure system consists of two tank units, one outdoor and one indoor unit. The outdoor vessel the main air storage tank has a volume of 9.9 m³. The indoor unit the blow-down vessel has a volume of 3.3 m³ (see Fig. 1). The maximum pressure capability of both units is 38.61 bar (560 psi).
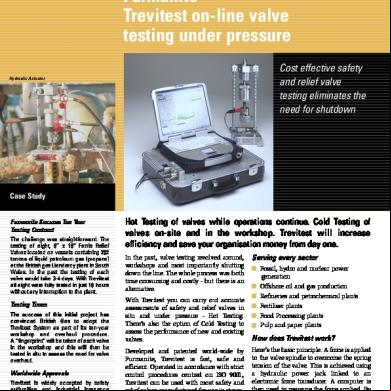
Fig. 1 Development test bench of Seetru Ltd. at Albion Dockside Works, Bristol, U.K.
Using a 3 way balanced valve, pressure is charged from the main air storage tank into the blow-down vessel (see Fig. 2).
Fig. 2 Development test bench sketch
To maintain accurate pressure recording, the pressure sensor is tapped close to the flange where the valve is to be tested, which is mounted onto the blow-down vessel (see Fig. 3).
5/14
TESON Benchmark
Fig. 3 Pressure sensor tap location
Two pressure sensors (acc. < 0.3 %) have been used to cover the different set pressures of the valves to be tested. One 0 –16 bar sensor covers lower set pressures and one 0100 bar sensor covers set pressures above 16 bar (see Table 1 on page 8). Both sensors had been purchased specially for the benchmark test.
3.1.2 Digital data recording system The development test bench was extended by METRUS GmbH´s Valve test 2.0 system, a digital system especially designed for extending valve test benches. This consists of software and an electronic system. Valve test 2.0 records the pressure inside the test bench whilst the test is carried out. Furthermore, the spindle lift is recorded to process a valve characteristic diagram as a basis for result analysis. The spindle lift measurement was made using a laser sensor with a resolution of 2 µm. The touch free laser measurement offers fast response to any movement and does not influence the valve set pressure at all (see Fig. 4).
Fig. 4 Laser sensor (blue item) mounted on the test sample, using the TESON rig
6/14
TESON Benchmark The Valve Test 2.0 software offers an easy to handle graphical interface that enables the to follow the test, looking at the diagrams as they are created. Once the test is done, the easily flips from the standard diagram to the valve characteristic by simply clicking on the related tab sheet header (see Fig. 5).
Fig. 5 Valve Test 2.0 GUI with standard diagram recorded over time
Using markers, the set pressure and reseating pressure are simply picked within the diagram itself.
3.2
TESON on-line valve testing system To perform the TESON on-line test, TESON serial no. 002 is used, which has been in regular operation at SES - Seetru Engineering Services since May 2001 and can be considered a standard TESON on-line valve testing system (see Fig. 6 and Fig. 7).
Fig. 6 TESON ser. no. 002 test rig
Fig. 7 TESON Power Box and computer
7/14
TESON Benchmark 3.2.1 Sensor system All TESON systems in operation have been and will be equipped with the same sensor and electronic system. To achieve a maximum of test accuracy for the benchmark, a complete set of new OEM force and pressure sensors have been utilised. Parameter Type
Manufacture
Range
Accuracy
Serial no.
Force
U2B
HBM GmbH
0 - 1 kN
0.1 %
J 63955
Force
U2B
HBM GmbH
0 - 10 kN
0.1 %
J 44164
Pressure
Y913
Bourdon-Henni
0 - 16 bar
< 0.3 %
Pressure
Y913
Bourdon-Henni
0 - 100 bar
< 0.3 %
Lift
WA50
HBM GmbH
0 –50 mm
0.1 %
050210105
Table 1 Sensors used with the TESON system
The electronic system was calibrated to an accuracy of < 0.02 % before the test was carried out.
3.2.2 Software system and calculations The TESON software version used is release 2.1.4.552. All tests are carried out using the automatic test feature of the TESON software, where the computer controls the force generating process. This is the standard test method used by TESON technicians in their every day work. As in the Valve Test 2.0 system, points like the set pressure point are picked from the diagram by using markers operated with the mouse (see Fig. 8)
Fig. 8 The TESON software GUI
With the numeric values taken from the set pressure point picked in the diagram, TESON calculates the set pressure using the following formula:
8/14
TESON Benchmark
p Set = PSet PSys AS F
4
F + p Sys AS
Safety valve set pressure System pressure at set pressure point [pa] Active valve seat area [m²] Hydraulic force at set pressure point [N]
Test procedure Considering the formula, the safety valves seat diameter and seat geometry will influence the on-line test result accuracy as much as the system pressure during the test. Therefore, comparison tests have to be carried out at various levels of system pressures for various sizes of valves. Eight valves of various sizes and types have been selected for testing, first on the development test bench only and afterwards by the TESON system. A TESON test is performed at a level of approximately 0%, 25%, 50% and 75% of the set pressure. For each level, the TESON result is calculated using the active seat area provided by the valve manufacturer (OEM diameter) wherever available or the mean measured diameter of the valve’s seat. Comparing the TESON and the development test bench results leads to the final benchmark result. The development test bench result is considered the "true" set pressure of the safety valve. To withstand third party investigations, the set pressure is always identified using the same method. This method is based only on the result diagrams and does not leave any space for individual interpretation.
4.1
Identifying the set pressure on the development test bench The Valve Test 2.0 software delivers a standard (time related) diagram and a valve characteristic diagram at the end of the test. Following the creation of the standard diagram on the screen during the test procedure, it was clearly visible that the moment you hear the sound of the valve starting to leak, you see the signal of the disk lift starting to rise. Increasing the pressure further on, the valve would soon fully open. Within the valve characteristic diagram, the point of the initial lift is easily found. Using the mouse, the set pressure marker is set within the diagram to get the pressure value of the set pressure point (see Fig. 9).
9/14
TESON Benchmark
Point of initial lift (set pressure) marked with green marker
Fig. 9 Set pressure point in the valve characteristic diagram of the Valve Test 2.0 software
Fig. 10 Zoomed view of Valve Test 2.0 valve characteristic diagram
To precisely pick the set pressure point, a zoom function is available within the software (see Fig. 10)
4.2
Identifying the set pressure within the TESON test result As outlined in the introduction, TESON generates a lift-force-diagram (spring performance) from the lift and force data, recorded during the test itself. Such a diagram can be seen in Fig. 11
Disk movement
Test rig compression
Fig. 11 lift-force diagram of a TESON test (no system pressure)
10/14
TESON Benchmark No matter how the graph shape might look in the disc movement section, the end of the test rig compression when the disc initially starts to move can always be found. This is the point where TESON defines the set pressure to be. A zooming function s the most accurate pin pointing of that set pressure point (see Fig. 12).
Fig. 12 Zoomed view of the lift-force diagram
A printed report for each test is attached to this report to the proper selection of the TESON set pressure point. Each report can be identified using the unique test ID.
11/14
TESON Benchmark
5
Test results A total of 32 tests have been performed with TESON. Each valve was first tested with Valve test 2.0 and afterwards with TESON. The column named "Set pr.[bar]" holds the development test bench result. The column "Divergence [%]" is calculated as per: Divergence [%] =
Test bench result - TESON result × 100 Test bench result
TESON Benchmark test Test Valve Set pr. Active area System pr. System pr. TESON result Divergence [%] ID Serial no. [bar] [mm²] [bar] [%] of SP [bar] 1 LESER 2,86 560 0,00 0% 2,97 -4% 2% 4 96.46797.10.5 0,64 22% 2,79 2% 6 OEM diameter 26,7 mm 1,45 51% 2,81 2% 8 2,16 76% 2,8 3% 10 LESER 18,3 1360 15,83 86% 17,83 4% 12 96.30825.1/1 13,64 75% 17,52 14 OEM diameter 41,6 mm 9,57 52% 17,36 5% 5% 16 4,87 27% 17,34 2% 18 0,00 0% 17,94 2% 21 LESER 20,7 290 15,17 73% 20,27 3% 22 96.45067.32/1 10,28 50% 20,07 1% 23 OEM diameter 19,2 mm 5,33 26% 20,52 -4% 25 0,00 0% 21,45 0% 26 LESER 20,62 870 17,47 85% 20,63 0% 29 96.29400.18.2 14,84 72% 20,66 30 OEM diameter 33,3 mm 10,34 50% 21,19 -3% 3% 38 Berkett 04788 6,94 816,86 3,14 45% 6,73 2% 39 Middle diameter 32,2 mm 1,50 22% 6,81 -2% 40 LESER 9,95 2120 7,44 75% 10,14 41 96.293363/1 7,55 76% 10,12 -2% -1% 42 OEM diameter 52 mm 8,91 90% 10,08 43 5,13 52% 9,93 0% 0% 44 2,70 27% 9,94 -1% 45 0,00 0% 10,05 3% 46 LESER 3,9 3680 1,064 27% 3,78 3% 49 96.53981.6.2 2,008 51% 3,8 4% 51 OEM diameter 68,5 mm 2,981 76% 3,75 4% 52 3,53 91% 3,73 2% 64 Triangle Sempel 29,31 604,81 26,04 89% 28,67 4% 65 A66956 21,89 75% 28,14 1% 66 Middle diameter 27,8 mm 14,66 50% 28,98 2% 67 7,33 25% 28,67 Table 2 Benchmark test result table
An overview report on all TESON test records, as well as a detailed one-page report on each TESON test on each test bench test can be found in the appendix. Please refer to the Test ID of each row to find the related TESON test report. Valve Test 2.0 reports are to be identified via the serial no. of the valve.
12/14
TESON Benchmark
5.1
Result analysis Analysing the result table and the 32 tests performed in total, the following statements can be made:
The divergence of the TESON result and the test bench result of a large volume test bench was never worse than 5 %
The divergence of the TESON result and the large volume test bench result is independent from the seat area size and independent from the actual set pressure level during the test
The average divergence, not considering the size, is 2.4 %
75 % of the 32 tests had an accuracy that is better or equal to 3 %
Fig. 13 Result graphics from the result table
5.2
Conclusions When testing a new valve on a large volume development test bench that is capable of simulating real plant conditions, the first audible leak and initial lift appear together. Considering the safety function of a safety valve, the initial lift point is defined by various safety valve manufacturers to be the true set pressure. As the TESON test offers a precise method of finding the initial lift point of the valve, it tests the real set pressure of the valve. With a worse case divergence of 5% within the 32 tests carried
13/14
TESON Benchmark out and a majority of tests with a divergence of 3% or better, TESON tests the true set pressure with a high degree of accuracy. Considering the influences affecting the set pressure of a safety valve from the test bench to the plant, and the changes of the valves condition due to operation, the online test of a safety valve in situ using TESON is the most reliable method to the set pressure of a safety relief valve wherever it is possible from a technical and operations safety point of view.
6
Appendix The following documents are to be found within this appendix. • Valve Data • Bench test printed reports • TESON printed reports • Calibration certificates
Valve Data Manufacturer
Valve Series
Serial no.
DN In/Out
Set press.
Seat diameter
[bar]
[mm]
LESER
4331.4044
96.46797.10.5
40 / 40
2,86
26,7
LESER
4412.4533
96.30825.1/1
40 / 65
18,3
41,6
LESER
4332.4154
96.45067.32/1
25 / 25
20,7
19,2
LESER
4412.4824
96.29400.18.2
1.5" / 2"
20,62
33,3
Bailey Birkett
GN-819
04788
1.5" / 2"
6,94
32,2
LESER
4412.4844
96.293363/1
2" / 3"
9,95
52,0
LESER
4412.4554
96.53981.6.2
65 / 100
3,9
68,5
Traingle Sempel
VSR.300.1.5"G2.5" A66956
29,31
27,8
1.5" / 2,5"
METRUS GmbH Heinrich-Vogl-Str. 25 DE 85560 Ebersberg T. +49 (8092) 868600 F. +49 (89) 954399993 [email protected]
14/14
TESON Benchmark Test
Test Report Development Test Bench
General
Sensor Data
Test Record ID
67
Lift sensor range minimum
0,00 mm
Recorded on
30.04.2003
Lift sensor range maximum
40,00 mm
Description
Development test bench test
Pressure sensor range minimum 0,00 bar
TestNo
2
Pressure sensor range maximum 16,00 bar
Valve Data
Test Results
SerialNo
96.46797.10.5
Manufacturer
Leser
ValveType
4331.4044
[bar]
Test pressure
2,86 bar
Maximum test lift
3,47 mm
[Normalised - NO scale]
[mm]
[sec]
Marker colours:
Graph colours:
Green = Set pressure Red = Reseating pressure Blue = Opening pressure
Red = Lift [kN] Blue = Pressure [bar]
TESON Benchmark Test
Test Report Development Test Bench
General
Sensor Data
Test Record ID
68
Lift sensor range minimum
0,00 mm
Recorded on
30.04.2003
Lift sensor range maximum
40,00 mm
Description
Development test bench test
Pressure sensor range minimum 0,00 bar
TestNo
1
Pressure sensor range maximum 100,00 bar
Valve Data
Test Results
SerialNo
96.30825.1/1
Manufacturer
Leser
ValveType
4412.4533
[bar]
Test pressure
18,30 bar
Maximum test lift
7,27 mm
[Normalised - NO scale]
[mm]
[sec]
Marker colours:
Graph colours:
Green = Set pressure Red = Reseating pressure Blue = Opening pressure
Red = Lift [kN] Blue = Pressure [bar]
TESON Benchmark Test
Test Report Development Test Bench
General
Sensor Data
Test Record ID
75
Lift sensor range minimum
0,00 mm
Recorded on
30.04.2003
Lift sensor range maximum
40,00 mm
Description
Development test bench test
Pressure sensor range minimum 0,00 bar
TestNo
1
Pressure sensor range maximum 100,00 bar
Valve Data
Test Results
SerialNo
96.45067.32/1
Manufacturer
Leser
ValveType
4332.4154
[bar]
Test pressure
20,70 bar
Maximum test lift
2,02 mm
[Normalised - NO scale]
[mm]
[sec]
Marker colours:
Graph colours:
Green = Set pressure Red = Reseating pressure Blue = Opening pressure
Red = Lift [kN] Blue = Pressure [bar]
TESON Benchmark Test
Test Report Development Test Bench
General
Sensor Data
Test Record ID
78
Lift sensor range minimum
0,00 mm
Recorded on
30.04.2003
Lift sensor range maximum
40,00 mm
Description
Development test bench test
Pressure sensor range minimum 0,00 bar
TestNo
1
Pressure sensor range maximum 100,00 bar
Valve Data
Test Results
SerialNo
96.29400.18.2
Manufacturer
Leser
ValveType
4412.4824
[bar]
Test pressure
20,62 bar
Maximum test lift
8,23 mm
[Normalised - NO scale]
[mm]
[sec]
Marker colours:
Graph colours:
Green = Set pressure Red = Reseating pressure Blue = Opening pressure
Red = Lift [kN] Blue = Pressure [bar]
TESON Benchmark Test
Test Report Development Test Bench
General
Sensor Data
Test Record ID
79
Lift sensor range minimum
0,00 mm
Recorded on
30.04.2003
Lift sensor range maximum
40,00 mm
Description
Development test bench test
Pressure sensor range minimum 0,00 bar
TestNo
1
Pressure sensor range maximum 100,00 bar
Valve Data
Test Results
SerialNo
04788
Manufacturer
Berkett
ValveType
unkown
[bar]
Test pressure
6,94 bar
Maximum test lift
0,79 mm
[Normalised - NO scale]
[mm]
[sec]
Marker colours:
Graph colours:
Green = Set pressure Red = Reseating pressure Blue = Opening pressure
Red = Lift [kN] Blue = Pressure [bar]
TESON Benchmark Test
Test Report Development Test Bench
General
Sensor Data
Test Record ID
81
Lift sensor range minimum
0,00 mm
Recorded on
30.04.2003
Lift sensor range maximum
40,00 mm
Description
Development test bench test
Pressure sensor range minimum 0,00 bar
TestNo
1
Pressure sensor range maximum 16,00 bar
Valve Data
Test Results
SerialNo
96.293363/1
Manufacturer
Leser
ValveType
4412.4844
[bar]
Test pressure
9,95 bar
Maximum test lift
10,00 mm
[Normalised - NO scale]
[mm]
[sec]
Marker colours:
Graph colours:
Green = Set pressure Red = Reseating pressure Blue = Opening pressure
Red = Lift [kN] Blue = Pressure [bar]
TESON Benchmark Test
Test Report Development Test Bench
General
Sensor Data
Test Record ID
82
Lift sensor range minimum
0,00 mm
Recorded on
30.04.2003
Lift sensor range maximum
40,00 mm
Description
Development test bench test
Pressure sensor range minimum 0,00 bar
TestNo
1
Pressure sensor range maximum 16,00 bar
Valve Data
Test Results
SerialNo
96.53981.6.2
Manufacturer
Leser
ValveType
4412.4554
[bar]
Test pressure
3,90 bar
Maximum test lift
1,22 mm
[Normalised - NO scale]
[mm]
[sec]
Marker colours:
Graph colours:
Green = Set pressure Red = Reseating pressure Blue = Opening pressure
Red = Lift [kN] Blue = Pressure [bar]
TESON Benchmark Test
Test Report Development Test Bench
General
Sensor Data
Test Record ID
84
Lift sensor range minimum
0,00 mm
Recorded on
07.05.2003
Lift sensor range maximum
40,00 mm
Description
Development test bench test
Pressure sensor range minimum 0,00 bar
TestNo
Pressure sensor range maximum 100,00 bar
Valve Data
Test Results
SerialNo
A66956
Manufacturer
Triangle Semple
ValveType
VSR.300.1.5"G2.5".1.5.l.1
[bar]
Test pressure
29,31 bar
Maximum test lift
0,01 mm
[Normalised - NO scale]
[mm]
[sec]
Marker colours:
Graph colours:
Green = Set pressure Red = Reseating pressure Blue = Opening pressure
Red = Lift [kN] Blue = Pressure [bar]
TESON - Benchmark tests Overview report kN ID 1
Cold test
Manufacturer
LESER GmbH
Valve serie
4331.4044
Serial No
96.46797.10.5 (oem)
Seat area [mm²]
560
Exp. Set pressure
2,86
Set pressure [bar] 2,95 sec
mm
kN ID 4
25% system pressure test
Manufacturer
LESER GmbH
Valve serie
4331.4044
Serial No
96.46797.10.5 (oem)
Seat area [mm²]
560
Exp. Set pressure
2,86
Set pressure [bar] 2,79 sec
mm
kN ID 6
50 % system pressure test
Manufacturer
LESER GmbH
Valve serie
4331.4044
Serial No
96.46797.10.5 (oem)
Seat area [mm²]
560
Exp. Set pressure
2,86
Set pressure [bar] 2,81 sec
mm
kN ID 8
75 % system pressure test
Manufacturer
LESER GmbH
Valve serie
4331.4044
Serial No
96.46797.10.5 (oem)
Seat area [mm²]
560
Exp. Set pressure
2,86
Set pressure [bar] 2,80 sec
mm
Page
1
TESON - Benchmark tests Overview report kN ID 10
86 % system pressure test
Manufacturer
LESER GmbH
Valve serie
4412.4533
Serial No
96.30825.1/1 (oem)
Seat area [mm²]
1360
Exp. Set pressure
18,3
Set pressure [bar] 17,83 sec
mm
kN ID 12
75 % system pressure test
Manufacturer
LESER GmbH
Valve serie
4412.4533
Serial No
96.30825.1/1 (oem)
Seat area [mm²]
1360
Exp. Set pressure
18,3
Set pressure [bar] 17,52 sec
mm
kN ID 14
50 % system pressure test
Manufacturer
LESER GmbH
Valve serie
4412.4533
Serial No
96.30825.1/1 (oem)
Seat area [mm²]
1360
Exp. Set pressure
18,3
Set pressure [bar] 17,36 sec
mm
kN ID 16
25 % system pressure test
Manufacturer
LESER GmbH
Valve serie
4412.4533
Serial No
96.30825.1/1 (oem)
Seat area [mm²]
1360
Exp. Set pressure
18,3
Set pressure [bar] 17,34 sec
mm
Page
2
TESON - Benchmark tests Overview report kN ID 18
Cold test
Manufacturer
LESER GmbH
Valve serie
4412.4533
Serial No
96.30825.1/1 (oem)
Seat area [mm²]
1360
Exp. Set pressure
18,3
Set pressure [bar] 17,94 sec
mm
kN ID 21
75% system pressure test
Manufacturer
LESER GmbH
Valve serie
4332.4154
Serial No
96.45067.32/1 (oem)
Seat area [mm²]
290
Exp. Set pressure
20,7
Set pressure [bar] 20,27 sec
mm
kN ID 22
50% system pressure test
Manufacturer
LESER GmbH
Valve serie
4332.4154
Serial No
96.45067.32/1 (oem)
Seat area [mm²]
290
Exp. Set pressure
20,7
Set pressure [bar] 20,07 sec
mm
kN ID 23
25% system pressure test
Manufacturer
LESER GmbH
Valve serie
4332.4154
Serial No
96.45067.32/1 (oem)
Seat area [mm²]
290
Exp. Set pressure
20,7
Set pressure [bar] 20,52 sec
mm
Page
3
TESON - Benchmark tests Overview report kN ID 25
Cold test
Manufacturer
LESER GmbH
Valve serie
4332.4154
Serial No
96.45067.32/1 (oem)
Seat area [mm²]
290
Exp. Set pressure
20,7
Set pressure [bar] 21,45 sec
mm
kN ID 26
90% System pressure
Manufacturer
LESER GmbH
Valve serie
4412.4824
Serial No
96.29400.18.2 (oem)
Seat area [mm²]
870
Exp. Set pressure
20,62
Set pressure [bar] 20,63 sec
mm
kN ID 29
75 % System pressure
Manufacturer
LESER GmbH
Valve serie
4412.4824
Serial No
96.29400.18.2 (oem)
Seat area [mm²]
870
Exp. Set pressure
20,62
Set pressure [bar] 20,66 sec
mm
kN ID 30
50 % System pressure
Manufacturer
LESER GmbH
Valve serie
4412.4824
Serial No
96.29400.18.2 (md)
Seat area [mm²]
881,41
Exp. Set pressure
20,62
Set pressure [bar] 21,06 sec
mm
Page
4
TESON - Benchmark tests Overview report kN ID 38
50% system pressure
Manufacturer
Birkett
Valve serie
GN-819
Serial No
04788
Seat area [mm²]
816,86
Exp. Set pressure
6,94
Set pressure [bar] 6,73 sec
mm
kN ID 39
25% system pressure
Manufacturer
Birkett
Valve serie
GN-819
Serial No
04788
Seat area [mm²]
816,86
Exp. Set pressure
6,94
Set pressure [bar] 6,81 sec
mm
kN ID 40
75% system pressure
Manufacturer
LESER GmbH
Valve serie
4412.4844
Serial No
96.293363/1
Seat area [mm²]
2120
Exp. Set pressure
9,95
Set pressure [bar] 10,14 sec
mm
kN ID 41
75% system pressure 2nd
Manufacturer
LESER GmbH
Valve serie
4412.4844
Serial No
96.293363/1
Seat area [mm²]
2120
Exp. Set pressure
9,95
Set pressure [bar] 9,88 sec
mm
Page
5
TESON - Benchmark tests Overview report kN ID 42
90% system pressure
Manufacturer
LESER GmbH
Valve serie
4412.4844
Serial No
96.293363/1
Seat area [mm²]
2120
Exp. Set pressure
9,95
Set pressure [bar] 10,08 sec
mm
kN ID 43
50% system pressure
Manufacturer
LESER GmbH
Valve serie
4412.4844
Serial No
96.293363/1
Seat area [mm²]
2120
Exp. Set pressure
9,95
Set pressure [bar] 9,93 sec
mm
kN ID 44
25% system pressure
Manufacturer
LESER GmbH
Valve serie
4412.4844
Serial No
96.293363/1
Seat area [mm²]
2120
Exp. Set pressure
9,95
Set pressure [bar] 9,94 sec
mm
kN ID 45
Cold test
Manufacturer
LESER GmbH
Valve serie
4412.4844
Serial No
96.293363/1
Seat area [mm²]
2120
Exp. Set pressure
9,95
Set pressure [bar] 10,05 sec
mm
Page
6
TESON - Benchmark tests Overview report kN ID 46
25% system pressure
Manufacturer
LESER GmbH
Valve serie
4412.4554
Serial No
96.53981.6.2 (oem)
Seat area [mm²]
3680
Exp. Set pressure
3,9
Set pressure [bar] 3,78 sec
mm
kN ID 49
50% system pressure
Manufacturer
LESER GmbH
Valve serie
4412.4554
Serial No
96.53981.6.2 (oem)
Seat area [mm²]
3680
Exp. Set pressure
3,9
Set pressure [bar] 3,76 sec
mm
kN ID 51
75% system pressure
Manufacturer
LESER GmbH
Valve serie
4412.4554
Serial No
96.53981.6.2 (oem)
Seat area [mm²]
3680
Exp. Set pressure
3,9
Set pressure [bar] 3,75 sec
mm
kN ID 52
90% system pressure
Manufacturer
LESER GmbH
Valve serie
4412.4554
Serial No
96.53981.6.2 (oem)
Seat area [mm²]
3680
Exp. Set pressure
3,9
Set pressure [bar] 3,73 sec
mm
Page
7
TESON - Benchmark tests Overview report kN ID 64
90% set pressure test
Manufacturer
Triangle Semple
Valve serie
VSR.300.1.5"G2.5".1.5.
Serial No
A66956 (md)
Seat area [mm²]
604,81
Exp. Set pressure
29,31
Set pressure [bar] 28,67 sec
mm
kN ID 65
75% set pressure test
Manufacturer
Triangle Semple
Valve serie
VSR.300.1.5"G2.5".1.5.
Serial No
A66956 (md)
Seat area [mm²]
604,81
Exp. Set pressure
29,31
Set pressure [bar] 28,14 sec
mm
kN ID 66
50% set pressure test
Manufacturer
Triangle Semple
Valve serie
VSR.300.1.5"G2.5".1.5.
Serial No
A66956 (md)
Seat area [mm²]
604,81
Exp. Set pressure
29,31
Set pressure [bar] 28,98 sec
mm
kN ID 67
25% set pressure test
Manufacturer
Triangle Semple
Valve serie
VSR.300.1.5"G2.5".1.5.
Serial No
A66956 (md)
Seat area [mm²]
604,81
Exp. Set pressure
29,31
Set pressure [bar] 28,35 sec
mm
Page
8
To prove the accuracy of the results of the on-line valve testing system TESON, test comparisons have been carried out to how close the TESON test results are to the set pressure of a valve, identified on a high volume development test bench. Result Worst divergence 5% Typical divergence < 3% Average divergence 2.4%
TESON Benchmark
1
Executive Summary The in situ set pressure verification, also known as on-line safety and relief valve testing has been recognised in industry since the early 80s. Different testing systems are to be found on the market since then. TESON did introduce a totally new approach on how to identify the set pressure within the result diagrams, created during the test procedure itself. Focusing on the fact, that a safety relief valve is primarily a preloaded spring, a spring performance diagram (force-lift-diagram) is generated from the recorded data. Within the spring performance diagram, the set pressure is easily and precisely found at the moment the valve disk starts to move. Considering the fact that the on-line test result is calculated, this leads to an uncertain theoretical result. Based on the calculus of error, the resulting uncertainty decreases the larger the valve is and the more line pressure (system pressure) there is when the valve is tested. To how close the TESON test results gets to the real set pressure, comparison tests have been carried out on a large volume test bench of a safety valve manufacturer in Bristol, U.K. A total of 32 tests have been carried out on 8 valves of different sizes at various line pressures. To most accurately find the set pressure point of the valves, the test bench was equipped with a digital lift and pressure recording system. Testing the new and overhauled valves, it became evident that initial lift and first audible leak appear together. Therefore, the set pressure identified on a test bench can be considered the real set pressure of a safety valve. Identifying the set pressure based on the initial lift as well, TESON reaches high result accuracy. Within the 32 tests carried out, the worst divergence between the test bench result and the TESON result was 5% where as 75% of the tests had a divergence of 3% or less. Most surprising, the divergence to be found is independent of valve size and line pressure. Based on those results, TESON has been proven to most accurately tell the real set pressure of the safety relief valve. Experiences show that on-line valve tests carried out in all different types of industrial plants lead to a significantly higher or lower set pressure of safety relief valves. As the TESON system has proven to tell the true set pressure, the explanation for the divergence is the valve in operational condition being different to the valve in workshop conditions when tested on the test bench. Whenever the safety relief valves set pressure is of a higher concern, it should be tested on-line in its operational conditions if possible.
2/14
TESON Benchmark
Content
1 Executive Summary _____________________________________________________ 2 2 Introduction ___________________________________________________________ 4 3 Test set up and facilities_________________________________________________ 4 3.1 Development test bench _____________________________________________ 5 3.1.1
Pressure system _____________________________________________ 5
3.1.2
Digital data recording system __________________________________ 6
3.2 TESON on-line valve testing system ____________________________________ 7 3.2.1
Sensor system _______________________________________________ 8
3.2.2
Software system and calculations_______________________________ 8
4 Test procedure _________________________________________________________ 9 4.1 Identifying the set pressure on the development test bench _______________ 9 4.2 Identifying the set pressure within the TESON test result_________________ 10 5 Test results ___________________________________________________________ 12 5.1 Result analysis ____________________________________________________ 13 5.2 Conclusions _______________________________________________________ 13 6 Appendix _____________________________________________________________ 14
3/14
TESON Benchmark
2
Introduction Identifying a safety valves set pressure in-situ while the connected pressure vessel remains in full operation is known as "on-line" testing or "in-situ set pressure verification" since the early 80's. This method utilises lifting equipment – so called test rigs – to open safety valves by pulling the valves spindle, recording the lifting force and the lift and pressure simultaneously. An expert is capable of identifying the set pressure point from the recorded diagram and to calculate the set pressure of the safety valve. TESON introduces a totally new and unique approach to on-line safety valve testing. The analysis and identification of the set pressure point based on a lift-force diagram and the spring performance of the safety valve that is created from the lift and force data, recorded during the test procedure itself. That approach leads to a clearly visible point in each diagram recorded, which is the very moment when the valve disk starts to lift from the nozzle. Within the TESON test, the "lifting point" is defined to be the set pressure point of the safety valve. The TESON approach does not require expertise and long time experience to find this lifting point, eliminating the option to technically "negotiate" a result towards a desired value there by. Neither does it require any observation of the valve during the test to find the set pressure point later. The only required source is the diagram itself, enabling a correct analysis even a long time after the test itself has been carried out. As TESON is recognised on the market to deliver most accurate results, a benchmark test should give a final overall accuracy where this is possible to be achieved. Due to the fact, that a standard workshop test bench can never offer enough pressure capacity to simulate an on-line valve test, it requires a huge volume test bench that can only be found in development laboratories of safety valve manufactures. Seetru Ltd, situated in Bristol, operates a development test bench, which is capable of identifying the real set pressure of a safety valve, as well as simulating the on-line test for the TESON system, which is utilised by their service department SES – Seetru Engineering Services. This document is the full report of the benchmark test performed at Seetru Ltd. in May 2003. It includes all details of the test set up, test procedures, as well as all test reports created during the two-day experiment in Bristol, U.K. All tests have been carried out under the supervision of Andrew Varga, MD Seetru Ltd., and Johannes Junior, MD METRUS GmbH, designer and producer of the TESON system.
3
Test set up and facilities The testing conditions to be found at the research and development laboratory at Seetru Ltd Albion Dockside Works, Bristol, U.K, as well as the available stock of various safety relief valves offers the required base to perform a convincing benchmark test.
4/14
TESON Benchmark
3.1
Development test bench The development test bench is designed to simulate real plant conditions up to approximately 40-bar system pressure.
3.1.1 Pressure system The pressure system consists of two tank units, one outdoor and one indoor unit. The outdoor vessel the main air storage tank has a volume of 9.9 m³. The indoor unit the blow-down vessel has a volume of 3.3 m³ (see Fig. 1). The maximum pressure capability of both units is 38.61 bar (560 psi).
Fig. 1 Development test bench of Seetru Ltd. at Albion Dockside Works, Bristol, U.K.
Using a 3 way balanced valve, pressure is charged from the main air storage tank into the blow-down vessel (see Fig. 2).
Fig. 2 Development test bench sketch
To maintain accurate pressure recording, the pressure sensor is tapped close to the flange where the valve is to be tested, which is mounted onto the blow-down vessel (see Fig. 3).
5/14
TESON Benchmark
Fig. 3 Pressure sensor tap location
Two pressure sensors (acc. < 0.3 %) have been used to cover the different set pressures of the valves to be tested. One 0 –16 bar sensor covers lower set pressures and one 0100 bar sensor covers set pressures above 16 bar (see Table 1 on page 8). Both sensors had been purchased specially for the benchmark test.
3.1.2 Digital data recording system The development test bench was extended by METRUS GmbH´s Valve test 2.0 system, a digital system especially designed for extending valve test benches. This consists of software and an electronic system. Valve test 2.0 records the pressure inside the test bench whilst the test is carried out. Furthermore, the spindle lift is recorded to process a valve characteristic diagram as a basis for result analysis. The spindle lift measurement was made using a laser sensor with a resolution of 2 µm. The touch free laser measurement offers fast response to any movement and does not influence the valve set pressure at all (see Fig. 4).
Fig. 4 Laser sensor (blue item) mounted on the test sample, using the TESON rig
6/14
TESON Benchmark The Valve Test 2.0 software offers an easy to handle graphical interface that enables the to follow the test, looking at the diagrams as they are created. Once the test is done, the easily flips from the standard diagram to the valve characteristic by simply clicking on the related tab sheet header (see Fig. 5).
Fig. 5 Valve Test 2.0 GUI with standard diagram recorded over time
Using markers, the set pressure and reseating pressure are simply picked within the diagram itself.
3.2
TESON on-line valve testing system To perform the TESON on-line test, TESON serial no. 002 is used, which has been in regular operation at SES - Seetru Engineering Services since May 2001 and can be considered a standard TESON on-line valve testing system (see Fig. 6 and Fig. 7).
Fig. 6 TESON ser. no. 002 test rig
Fig. 7 TESON Power Box and computer
7/14
TESON Benchmark 3.2.1 Sensor system All TESON systems in operation have been and will be equipped with the same sensor and electronic system. To achieve a maximum of test accuracy for the benchmark, a complete set of new OEM force and pressure sensors have been utilised. Parameter Type
Manufacture
Range
Accuracy
Serial no.
Force
U2B
HBM GmbH
0 - 1 kN
0.1 %
J 63955
Force
U2B
HBM GmbH
0 - 10 kN
0.1 %
J 44164
Pressure
Y913
Bourdon-Henni
0 - 16 bar
< 0.3 %
Pressure
Y913
Bourdon-Henni
0 - 100 bar
< 0.3 %
Lift
WA50
HBM GmbH
0 –50 mm
0.1 %
050210105
Table 1 Sensors used with the TESON system
The electronic system was calibrated to an accuracy of < 0.02 % before the test was carried out.
3.2.2 Software system and calculations The TESON software version used is release 2.1.4.552. All tests are carried out using the automatic test feature of the TESON software, where the computer controls the force generating process. This is the standard test method used by TESON technicians in their every day work. As in the Valve Test 2.0 system, points like the set pressure point are picked from the diagram by using markers operated with the mouse (see Fig. 8)
Fig. 8 The TESON software GUI
With the numeric values taken from the set pressure point picked in the diagram, TESON calculates the set pressure using the following formula:
8/14
TESON Benchmark
p Set = PSet PSys AS F
4
F + p Sys AS
Safety valve set pressure System pressure at set pressure point [pa] Active valve seat area [m²] Hydraulic force at set pressure point [N]
Test procedure Considering the formula, the safety valves seat diameter and seat geometry will influence the on-line test result accuracy as much as the system pressure during the test. Therefore, comparison tests have to be carried out at various levels of system pressures for various sizes of valves. Eight valves of various sizes and types have been selected for testing, first on the development test bench only and afterwards by the TESON system. A TESON test is performed at a level of approximately 0%, 25%, 50% and 75% of the set pressure. For each level, the TESON result is calculated using the active seat area provided by the valve manufacturer (OEM diameter) wherever available or the mean measured diameter of the valve’s seat. Comparing the TESON and the development test bench results leads to the final benchmark result. The development test bench result is considered the "true" set pressure of the safety valve. To withstand third party investigations, the set pressure is always identified using the same method. This method is based only on the result diagrams and does not leave any space for individual interpretation.
4.1
Identifying the set pressure on the development test bench The Valve Test 2.0 software delivers a standard (time related) diagram and a valve characteristic diagram at the end of the test. Following the creation of the standard diagram on the screen during the test procedure, it was clearly visible that the moment you hear the sound of the valve starting to leak, you see the signal of the disk lift starting to rise. Increasing the pressure further on, the valve would soon fully open. Within the valve characteristic diagram, the point of the initial lift is easily found. Using the mouse, the set pressure marker is set within the diagram to get the pressure value of the set pressure point (see Fig. 9).
9/14
TESON Benchmark
Point of initial lift (set pressure) marked with green marker
Fig. 9 Set pressure point in the valve characteristic diagram of the Valve Test 2.0 software
Fig. 10 Zoomed view of Valve Test 2.0 valve characteristic diagram
To precisely pick the set pressure point, a zoom function is available within the software (see Fig. 10)
4.2
Identifying the set pressure within the TESON test result As outlined in the introduction, TESON generates a lift-force-diagram (spring performance) from the lift and force data, recorded during the test itself. Such a diagram can be seen in Fig. 11
Disk movement
Test rig compression
Fig. 11 lift-force diagram of a TESON test (no system pressure)
10/14
TESON Benchmark No matter how the graph shape might look in the disc movement section, the end of the test rig compression when the disc initially starts to move can always be found. This is the point where TESON defines the set pressure to be. A zooming function s the most accurate pin pointing of that set pressure point (see Fig. 12).
Fig. 12 Zoomed view of the lift-force diagram
A printed report for each test is attached to this report to the proper selection of the TESON set pressure point. Each report can be identified using the unique test ID.
11/14
TESON Benchmark
5
Test results A total of 32 tests have been performed with TESON. Each valve was first tested with Valve test 2.0 and afterwards with TESON. The column named "Set pr.[bar]" holds the development test bench result. The column "Divergence [%]" is calculated as per: Divergence [%] =
Test bench result - TESON result × 100 Test bench result
TESON Benchmark test Test Valve Set pr. Active area System pr. System pr. TESON result Divergence [%] ID Serial no. [bar] [mm²] [bar] [%] of SP [bar] 1 LESER 2,86 560 0,00 0% 2,97 -4% 2% 4 96.46797.10.5 0,64 22% 2,79 2% 6 OEM diameter 26,7 mm 1,45 51% 2,81 2% 8 2,16 76% 2,8 3% 10 LESER 18,3 1360 15,83 86% 17,83 4% 12 96.30825.1/1 13,64 75% 17,52 14 OEM diameter 41,6 mm 9,57 52% 17,36 5% 5% 16 4,87 27% 17,34 2% 18 0,00 0% 17,94 2% 21 LESER 20,7 290 15,17 73% 20,27 3% 22 96.45067.32/1 10,28 50% 20,07 1% 23 OEM diameter 19,2 mm 5,33 26% 20,52 -4% 25 0,00 0% 21,45 0% 26 LESER 20,62 870 17,47 85% 20,63 0% 29 96.29400.18.2 14,84 72% 20,66 30 OEM diameter 33,3 mm 10,34 50% 21,19 -3% 3% 38 Berkett 04788 6,94 816,86 3,14 45% 6,73 2% 39 Middle diameter 32,2 mm 1,50 22% 6,81 -2% 40 LESER 9,95 2120 7,44 75% 10,14 41 96.293363/1 7,55 76% 10,12 -2% -1% 42 OEM diameter 52 mm 8,91 90% 10,08 43 5,13 52% 9,93 0% 0% 44 2,70 27% 9,94 -1% 45 0,00 0% 10,05 3% 46 LESER 3,9 3680 1,064 27% 3,78 3% 49 96.53981.6.2 2,008 51% 3,8 4% 51 OEM diameter 68,5 mm 2,981 76% 3,75 4% 52 3,53 91% 3,73 2% 64 Triangle Sempel 29,31 604,81 26,04 89% 28,67 4% 65 A66956 21,89 75% 28,14 1% 66 Middle diameter 27,8 mm 14,66 50% 28,98 2% 67 7,33 25% 28,67 Table 2 Benchmark test result table
An overview report on all TESON test records, as well as a detailed one-page report on each TESON test on each test bench test can be found in the appendix. Please refer to the Test ID of each row to find the related TESON test report. Valve Test 2.0 reports are to be identified via the serial no. of the valve.
12/14
TESON Benchmark
5.1
Result analysis Analysing the result table and the 32 tests performed in total, the following statements can be made:
The divergence of the TESON result and the test bench result of a large volume test bench was never worse than 5 %
The divergence of the TESON result and the large volume test bench result is independent from the seat area size and independent from the actual set pressure level during the test
The average divergence, not considering the size, is 2.4 %
75 % of the 32 tests had an accuracy that is better or equal to 3 %
Fig. 13 Result graphics from the result table
5.2
Conclusions When testing a new valve on a large volume development test bench that is capable of simulating real plant conditions, the first audible leak and initial lift appear together. Considering the safety function of a safety valve, the initial lift point is defined by various safety valve manufacturers to be the true set pressure. As the TESON test offers a precise method of finding the initial lift point of the valve, it tests the real set pressure of the valve. With a worse case divergence of 5% within the 32 tests carried
13/14
TESON Benchmark out and a majority of tests with a divergence of 3% or better, TESON tests the true set pressure with a high degree of accuracy. Considering the influences affecting the set pressure of a safety valve from the test bench to the plant, and the changes of the valves condition due to operation, the online test of a safety valve in situ using TESON is the most reliable method to the set pressure of a safety relief valve wherever it is possible from a technical and operations safety point of view.
6
Appendix The following documents are to be found within this appendix. • Valve Data • Bench test printed reports • TESON printed reports • Calibration certificates
Valve Data Manufacturer
Valve Series
Serial no.
DN In/Out
Set press.
Seat diameter
[bar]
[mm]
LESER
4331.4044
96.46797.10.5
40 / 40
2,86
26,7
LESER
4412.4533
96.30825.1/1
40 / 65
18,3
41,6
LESER
4332.4154
96.45067.32/1
25 / 25
20,7
19,2
LESER
4412.4824
96.29400.18.2
1.5" / 2"
20,62
33,3
Bailey Birkett
GN-819
04788
1.5" / 2"
6,94
32,2
LESER
4412.4844
96.293363/1
2" / 3"
9,95
52,0
LESER
4412.4554
96.53981.6.2
65 / 100
3,9
68,5
Traingle Sempel
VSR.300.1.5"G2.5" A66956
29,31
27,8
1.5" / 2,5"
METRUS GmbH Heinrich-Vogl-Str. 25 DE 85560 Ebersberg T. +49 (8092) 868600 F. +49 (89) 954399993 [email protected]
14/14
TESON Benchmark Test
Test Report Development Test Bench
General
Sensor Data
Test Record ID
67
Lift sensor range minimum
0,00 mm
Recorded on
30.04.2003
Lift sensor range maximum
40,00 mm
Description
Development test bench test
Pressure sensor range minimum 0,00 bar
TestNo
2
Pressure sensor range maximum 16,00 bar
Valve Data
Test Results
SerialNo
96.46797.10.5
Manufacturer
Leser
ValveType
4331.4044
[bar]
Test pressure
2,86 bar
Maximum test lift
3,47 mm
[Normalised - NO scale]
[mm]
[sec]
Marker colours:
Graph colours:
Green = Set pressure Red = Reseating pressure Blue = Opening pressure
Red = Lift [kN] Blue = Pressure [bar]
TESON Benchmark Test
Test Report Development Test Bench
General
Sensor Data
Test Record ID
68
Lift sensor range minimum
0,00 mm
Recorded on
30.04.2003
Lift sensor range maximum
40,00 mm
Description
Development test bench test
Pressure sensor range minimum 0,00 bar
TestNo
1
Pressure sensor range maximum 100,00 bar
Valve Data
Test Results
SerialNo
96.30825.1/1
Manufacturer
Leser
ValveType
4412.4533
[bar]
Test pressure
18,30 bar
Maximum test lift
7,27 mm
[Normalised - NO scale]
[mm]
[sec]
Marker colours:
Graph colours:
Green = Set pressure Red = Reseating pressure Blue = Opening pressure
Red = Lift [kN] Blue = Pressure [bar]
TESON Benchmark Test
Test Report Development Test Bench
General
Sensor Data
Test Record ID
75
Lift sensor range minimum
0,00 mm
Recorded on
30.04.2003
Lift sensor range maximum
40,00 mm
Description
Development test bench test
Pressure sensor range minimum 0,00 bar
TestNo
1
Pressure sensor range maximum 100,00 bar
Valve Data
Test Results
SerialNo
96.45067.32/1
Manufacturer
Leser
ValveType
4332.4154
[bar]
Test pressure
20,70 bar
Maximum test lift
2,02 mm
[Normalised - NO scale]
[mm]
[sec]
Marker colours:
Graph colours:
Green = Set pressure Red = Reseating pressure Blue = Opening pressure
Red = Lift [kN] Blue = Pressure [bar]
TESON Benchmark Test
Test Report Development Test Bench
General
Sensor Data
Test Record ID
78
Lift sensor range minimum
0,00 mm
Recorded on
30.04.2003
Lift sensor range maximum
40,00 mm
Description
Development test bench test
Pressure sensor range minimum 0,00 bar
TestNo
1
Pressure sensor range maximum 100,00 bar
Valve Data
Test Results
SerialNo
96.29400.18.2
Manufacturer
Leser
ValveType
4412.4824
[bar]
Test pressure
20,62 bar
Maximum test lift
8,23 mm
[Normalised - NO scale]
[mm]
[sec]
Marker colours:
Graph colours:
Green = Set pressure Red = Reseating pressure Blue = Opening pressure
Red = Lift [kN] Blue = Pressure [bar]
TESON Benchmark Test
Test Report Development Test Bench
General
Sensor Data
Test Record ID
79
Lift sensor range minimum
0,00 mm
Recorded on
30.04.2003
Lift sensor range maximum
40,00 mm
Description
Development test bench test
Pressure sensor range minimum 0,00 bar
TestNo
1
Pressure sensor range maximum 100,00 bar
Valve Data
Test Results
SerialNo
04788
Manufacturer
Berkett
ValveType
unkown
[bar]
Test pressure
6,94 bar
Maximum test lift
0,79 mm
[Normalised - NO scale]
[mm]
[sec]
Marker colours:
Graph colours:
Green = Set pressure Red = Reseating pressure Blue = Opening pressure
Red = Lift [kN] Blue = Pressure [bar]
TESON Benchmark Test
Test Report Development Test Bench
General
Sensor Data
Test Record ID
81
Lift sensor range minimum
0,00 mm
Recorded on
30.04.2003
Lift sensor range maximum
40,00 mm
Description
Development test bench test
Pressure sensor range minimum 0,00 bar
TestNo
1
Pressure sensor range maximum 16,00 bar
Valve Data
Test Results
SerialNo
96.293363/1
Manufacturer
Leser
ValveType
4412.4844
[bar]
Test pressure
9,95 bar
Maximum test lift
10,00 mm
[Normalised - NO scale]
[mm]
[sec]
Marker colours:
Graph colours:
Green = Set pressure Red = Reseating pressure Blue = Opening pressure
Red = Lift [kN] Blue = Pressure [bar]
TESON Benchmark Test
Test Report Development Test Bench
General
Sensor Data
Test Record ID
82
Lift sensor range minimum
0,00 mm
Recorded on
30.04.2003
Lift sensor range maximum
40,00 mm
Description
Development test bench test
Pressure sensor range minimum 0,00 bar
TestNo
1
Pressure sensor range maximum 16,00 bar
Valve Data
Test Results
SerialNo
96.53981.6.2
Manufacturer
Leser
ValveType
4412.4554
[bar]
Test pressure
3,90 bar
Maximum test lift
1,22 mm
[Normalised - NO scale]
[mm]
[sec]
Marker colours:
Graph colours:
Green = Set pressure Red = Reseating pressure Blue = Opening pressure
Red = Lift [kN] Blue = Pressure [bar]
TESON Benchmark Test
Test Report Development Test Bench
General
Sensor Data
Test Record ID
84
Lift sensor range minimum
0,00 mm
Recorded on
07.05.2003
Lift sensor range maximum
40,00 mm
Description
Development test bench test
Pressure sensor range minimum 0,00 bar
TestNo
Pressure sensor range maximum 100,00 bar
Valve Data
Test Results
SerialNo
A66956
Manufacturer
Triangle Semple
ValveType
VSR.300.1.5"G2.5".1.5.l.1
[bar]
Test pressure
29,31 bar
Maximum test lift
0,01 mm
[Normalised - NO scale]
[mm]
[sec]
Marker colours:
Graph colours:
Green = Set pressure Red = Reseating pressure Blue = Opening pressure
Red = Lift [kN] Blue = Pressure [bar]
TESON - Benchmark tests Overview report kN ID 1
Cold test
Manufacturer
LESER GmbH
Valve serie
4331.4044
Serial No
96.46797.10.5 (oem)
Seat area [mm²]
560
Exp. Set pressure
2,86
Set pressure [bar] 2,95 sec
mm
kN ID 4
25% system pressure test
Manufacturer
LESER GmbH
Valve serie
4331.4044
Serial No
96.46797.10.5 (oem)
Seat area [mm²]
560
Exp. Set pressure
2,86
Set pressure [bar] 2,79 sec
mm
kN ID 6
50 % system pressure test
Manufacturer
LESER GmbH
Valve serie
4331.4044
Serial No
96.46797.10.5 (oem)
Seat area [mm²]
560
Exp. Set pressure
2,86
Set pressure [bar] 2,81 sec
mm
kN ID 8
75 % system pressure test
Manufacturer
LESER GmbH
Valve serie
4331.4044
Serial No
96.46797.10.5 (oem)
Seat area [mm²]
560
Exp. Set pressure
2,86
Set pressure [bar] 2,80 sec
mm
Page
1
TESON - Benchmark tests Overview report kN ID 10
86 % system pressure test
Manufacturer
LESER GmbH
Valve serie
4412.4533
Serial No
96.30825.1/1 (oem)
Seat area [mm²]
1360
Exp. Set pressure
18,3
Set pressure [bar] 17,83 sec
mm
kN ID 12
75 % system pressure test
Manufacturer
LESER GmbH
Valve serie
4412.4533
Serial No
96.30825.1/1 (oem)
Seat area [mm²]
1360
Exp. Set pressure
18,3
Set pressure [bar] 17,52 sec
mm
kN ID 14
50 % system pressure test
Manufacturer
LESER GmbH
Valve serie
4412.4533
Serial No
96.30825.1/1 (oem)
Seat area [mm²]
1360
Exp. Set pressure
18,3
Set pressure [bar] 17,36 sec
mm
kN ID 16
25 % system pressure test
Manufacturer
LESER GmbH
Valve serie
4412.4533
Serial No
96.30825.1/1 (oem)
Seat area [mm²]
1360
Exp. Set pressure
18,3
Set pressure [bar] 17,34 sec
mm
Page
2
TESON - Benchmark tests Overview report kN ID 18
Cold test
Manufacturer
LESER GmbH
Valve serie
4412.4533
Serial No
96.30825.1/1 (oem)
Seat area [mm²]
1360
Exp. Set pressure
18,3
Set pressure [bar] 17,94 sec
mm
kN ID 21
75% system pressure test
Manufacturer
LESER GmbH
Valve serie
4332.4154
Serial No
96.45067.32/1 (oem)
Seat area [mm²]
290
Exp. Set pressure
20,7
Set pressure [bar] 20,27 sec
mm
kN ID 22
50% system pressure test
Manufacturer
LESER GmbH
Valve serie
4332.4154
Serial No
96.45067.32/1 (oem)
Seat area [mm²]
290
Exp. Set pressure
20,7
Set pressure [bar] 20,07 sec
mm
kN ID 23
25% system pressure test
Manufacturer
LESER GmbH
Valve serie
4332.4154
Serial No
96.45067.32/1 (oem)
Seat area [mm²]
290
Exp. Set pressure
20,7
Set pressure [bar] 20,52 sec
mm
Page
3
TESON - Benchmark tests Overview report kN ID 25
Cold test
Manufacturer
LESER GmbH
Valve serie
4332.4154
Serial No
96.45067.32/1 (oem)
Seat area [mm²]
290
Exp. Set pressure
20,7
Set pressure [bar] 21,45 sec
mm
kN ID 26
90% System pressure
Manufacturer
LESER GmbH
Valve serie
4412.4824
Serial No
96.29400.18.2 (oem)
Seat area [mm²]
870
Exp. Set pressure
20,62
Set pressure [bar] 20,63 sec
mm
kN ID 29
75 % System pressure
Manufacturer
LESER GmbH
Valve serie
4412.4824
Serial No
96.29400.18.2 (oem)
Seat area [mm²]
870
Exp. Set pressure
20,62
Set pressure [bar] 20,66 sec
mm
kN ID 30
50 % System pressure
Manufacturer
LESER GmbH
Valve serie
4412.4824
Serial No
96.29400.18.2 (md)
Seat area [mm²]
881,41
Exp. Set pressure
20,62
Set pressure [bar] 21,06 sec
mm
Page
4
TESON - Benchmark tests Overview report kN ID 38
50% system pressure
Manufacturer
Birkett
Valve serie
GN-819
Serial No
04788
Seat area [mm²]
816,86
Exp. Set pressure
6,94
Set pressure [bar] 6,73 sec
mm
kN ID 39
25% system pressure
Manufacturer
Birkett
Valve serie
GN-819
Serial No
04788
Seat area [mm²]
816,86
Exp. Set pressure
6,94
Set pressure [bar] 6,81 sec
mm
kN ID 40
75% system pressure
Manufacturer
LESER GmbH
Valve serie
4412.4844
Serial No
96.293363/1
Seat area [mm²]
2120
Exp. Set pressure
9,95
Set pressure [bar] 10,14 sec
mm
kN ID 41
75% system pressure 2nd
Manufacturer
LESER GmbH
Valve serie
4412.4844
Serial No
96.293363/1
Seat area [mm²]
2120
Exp. Set pressure
9,95
Set pressure [bar] 9,88 sec
mm
Page
5
TESON - Benchmark tests Overview report kN ID 42
90% system pressure
Manufacturer
LESER GmbH
Valve serie
4412.4844
Serial No
96.293363/1
Seat area [mm²]
2120
Exp. Set pressure
9,95
Set pressure [bar] 10,08 sec
mm
kN ID 43
50% system pressure
Manufacturer
LESER GmbH
Valve serie
4412.4844
Serial No
96.293363/1
Seat area [mm²]
2120
Exp. Set pressure
9,95
Set pressure [bar] 9,93 sec
mm
kN ID 44
25% system pressure
Manufacturer
LESER GmbH
Valve serie
4412.4844
Serial No
96.293363/1
Seat area [mm²]
2120
Exp. Set pressure
9,95
Set pressure [bar] 9,94 sec
mm
kN ID 45
Cold test
Manufacturer
LESER GmbH
Valve serie
4412.4844
Serial No
96.293363/1
Seat area [mm²]
2120
Exp. Set pressure
9,95
Set pressure [bar] 10,05 sec
mm
Page
6
TESON - Benchmark tests Overview report kN ID 46
25% system pressure
Manufacturer
LESER GmbH
Valve serie
4412.4554
Serial No
96.53981.6.2 (oem)
Seat area [mm²]
3680
Exp. Set pressure
3,9
Set pressure [bar] 3,78 sec
mm
kN ID 49
50% system pressure
Manufacturer
LESER GmbH
Valve serie
4412.4554
Serial No
96.53981.6.2 (oem)
Seat area [mm²]
3680
Exp. Set pressure
3,9
Set pressure [bar] 3,76 sec
mm
kN ID 51
75% system pressure
Manufacturer
LESER GmbH
Valve serie
4412.4554
Serial No
96.53981.6.2 (oem)
Seat area [mm²]
3680
Exp. Set pressure
3,9
Set pressure [bar] 3,75 sec
mm
kN ID 52
90% system pressure
Manufacturer
LESER GmbH
Valve serie
4412.4554
Serial No
96.53981.6.2 (oem)
Seat area [mm²]
3680
Exp. Set pressure
3,9
Set pressure [bar] 3,73 sec
mm
Page
7
TESON - Benchmark tests Overview report kN ID 64
90% set pressure test
Manufacturer
Triangle Semple
Valve serie
VSR.300.1.5"G2.5".1.5.
Serial No
A66956 (md)
Seat area [mm²]
604,81
Exp. Set pressure
29,31
Set pressure [bar] 28,67 sec
mm
kN ID 65
75% set pressure test
Manufacturer
Triangle Semple
Valve serie
VSR.300.1.5"G2.5".1.5.
Serial No
A66956 (md)
Seat area [mm²]
604,81
Exp. Set pressure
29,31
Set pressure [bar] 28,14 sec
mm
kN ID 66
50% set pressure test
Manufacturer
Triangle Semple
Valve serie
VSR.300.1.5"G2.5".1.5.
Serial No
A66956 (md)
Seat area [mm²]
604,81
Exp. Set pressure
29,31
Set pressure [bar] 28,98 sec
mm
kN ID 67
25% set pressure test
Manufacturer
Triangle Semple
Valve serie
VSR.300.1.5"G2.5".1.5.
Serial No
A66956 (md)
Seat area [mm²]
604,81
Exp. Set pressure
29,31
Set pressure [bar] 28,35 sec
mm
Page
8
More Documents from "Antonio Perez" 393oj
Trevitest .pdf w1d5h
November 2019 32
El Ramo Azul 6243z
September 2022 0
Sap 2000 w3z6i
June 2020 3
Autobildallrad_20190405_460392.pdf 5k6657
March 2023 0
Teson-benchmark-report-and-overview.pdf 2g6i6z
July 2020 0